Session Sweep Concept [Achira Meegasthanne]
Session Sweep Concept
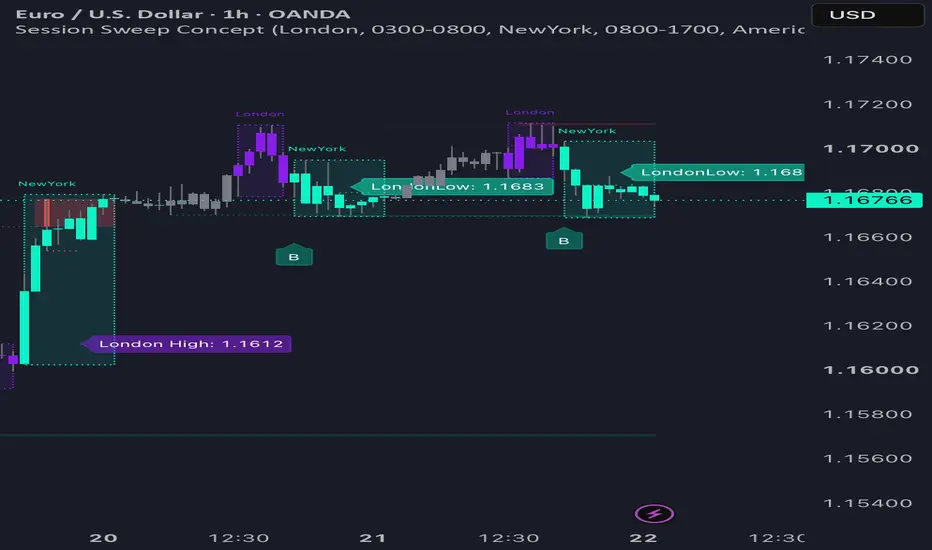
Session Sweep Concept is a price-action and liquidity-based indicator designed to help traders visualize session ranges, identify liquidity sweeps, and monitor potential market-structure shifts.
The indicator focuses on the relationship between a Start Session and an End Session, using the previous session's high and low as important liquidity reference levels.
🔹 KEY FEATURES
Session Range Detection
Automatically identifies and displays the selected Start Session and End Session ranges.
You can customize:
• Start Session
• End Session
• Session ranges
• Session timezone
• Session colors
💧 Liquidity Sweep Detection
The indicator monitors previous session highs and lows for potential liquidity sweeps.
It can identify situations where price:
• Takes the previous session high
• Takes the previous session low
• Sweeps liquidity with a wick
• Breaks a level and later retests it
This allows traders to visually study how price interacts with previously established liquidity levels.
📊 Market Structure & BoS
After a session liquidity sweep, the indicator can monitor subsequent market structure and identify potential Break of Structure (BoS) events.
BoS markings help visualize a possible shift in short-term price structure following a liquidity event.
📈 Optional Trend Filter
An optional trend filter uses EMA and ATR-based slope calculations to determine whether the market is showing bullish, bearish, or neutral conditions.
The trend filter can be enabled or disabled from the settings.
🎯 Swing & Liquidity Visualization
The indicator can display:
• Session Highs
• Session Lows
• Swing Points
• Liquidity Sweep Areas
• Break of Structure
• Bullish/Bearish Structure
• Session-Based Bar Coloring
Liquidity sweeps can be configured using:
• Only Wicks
• Only Outbreaks & Retest
• Wicks + Outbreaks & Retest
⚙️ CUSTOMIZATION
The indicator provides multiple controls, including:
• Session visibility
• Swing-point visibility
• Market-structure visibility
• BoS visibility
• Session timezone
• Session colors
• Swing colors
• Structure colors
• Liquidity sweep mode
• Trend filter
• Session-end trade cutoff
• Debug information
🧠 HOW THE CONCEPT WORKS
1. Define the Start Session
The indicator establishes the session high and low.
2. Monitor the End Session
Price is observed as it interacts with the previous session's range.
3. Identify Liquidity Sweeps
A move above the previous high or below the previous low can indicate that liquidity has been taken.
4. Monitor Market Structure
Following the sweep, the indicator looks for a potential structure shift.
5. Identify BoS
A confirmed structure break is marked on the chart for further analysis.
The overall framework is:
Session Liquidity → Sweep → Market Structure → BoS Confirmation
⚠️ IMPORTANT DISCLAIMER
This indicator is an analytical and educational tool and does not guarantee profitable trading results.
Liquidity sweeps and Break of Structure signals can occur in many market conditions and should not be treated as standalone buy or sell signals.
Always perform your own analysis, use proper risk management, and test the indicator on historical and real-time market data before relying on it for live trading.
Use this tool to understand price behavior — not to predict the market with certainty.
Session Sweep Concept is a price-action and liquidity-based indicator designed to help traders visualize session ranges, identify liquidity sweeps, and monitor potential market-structure shifts.
The indicator focuses on the relationship between a Start Session and an End Session, using the previous session's high and low as important liquidity reference levels.
🔹 KEY FEATURES
Session Range Detection
Automatically identifies and displays the selected Start Session and End Session ranges.
You can customize:
• Start Session
• End Session
• Session ranges
• Session timezone
• Session colors
💧 Liquidity Sweep Detection
The indicator monitors previous session highs and lows for potential liquidity sweeps.
It can identify situations where price:
• Takes the previous session high
• Takes the previous session low
• Sweeps liquidity with a wick
• Breaks a level and later retests it
This allows traders to visually study how price interacts with previously established liquidity levels.
📊 Market Structure & BoS
After a session liquidity sweep, the indicator can monitor subsequent market structure and identify potential Break of Structure (BoS) events.
BoS markings help visualize a possible shift in short-term price structure following a liquidity event.
📈 Optional Trend Filter
An optional trend filter uses EMA and ATR-based slope calculations to determine whether the market is showing bullish, bearish, or neutral conditions.
The trend filter can be enabled or disabled from the settings.
🎯 Swing & Liquidity Visualization
The indicator can display:
• Session Highs
• Session Lows
• Swing Points
• Liquidity Sweep Areas
• Break of Structure
• Bullish/Bearish Structure
• Session-Based Bar Coloring
Liquidity sweeps can be configured using:
• Only Wicks
• Only Outbreaks & Retest
• Wicks + Outbreaks & Retest
⚙️ CUSTOMIZATION
The indicator provides multiple controls, including:
• Session visibility
• Swing-point visibility
• Market-structure visibility
• BoS visibility
• Session timezone
• Session colors
• Swing colors
• Structure colors
• Liquidity sweep mode
• Trend filter
• Session-end trade cutoff
• Debug information
🧠 HOW THE CONCEPT WORKS
1. Define the Start Session
The indicator establishes the session high and low.
2. Monitor the End Session
Price is observed as it interacts with the previous session's range.
3. Identify Liquidity Sweeps
A move above the previous high or below the previous low can indicate that liquidity has been taken.
4. Monitor Market Structure
Following the sweep, the indicator looks for a potential structure shift.
5. Identify BoS
A confirmed structure break is marked on the chart for further analysis.
The overall framework is:
Session Liquidity → Sweep → Market Structure → BoS Confirmation
⚠️ IMPORTANT DISCLAIMER
This indicator is an analytical and educational tool and does not guarantee profitable trading results.
Liquidity sweeps and Break of Structure signals can occur in many market conditions and should not be treated as standalone buy or sell signals.
Always perform your own analysis, use proper risk management, and test the indicator on historical and real-time market data before relying on it for live trading.
Use this tool to understand price behavior — not to predict the market with certainty.

Declinazione di responsabilità
Le informazioni e le pubblicazioni non sono intese come, e non costituiscono, consulenza o raccomandazioni finanziarie, di investimento, di trading o di altro tipo fornite o approvate da TradingView. Per ulteriori informazioni, consultare i Termini di utilizzo.
Declinazione di responsabilità
Le informazioni e le pubblicazioni non sono intese come, e non costituiscono, consulenza o raccomandazioni finanziarie, di investimento, di trading o di altro tipo fornite o approvate da TradingView. Per ulteriori informazioni, consultare i Termini di utilizzo.