OPEN-SOURCE SCRIPT
RichmondHillCM - BTC Power Law - Log Price Linear Time
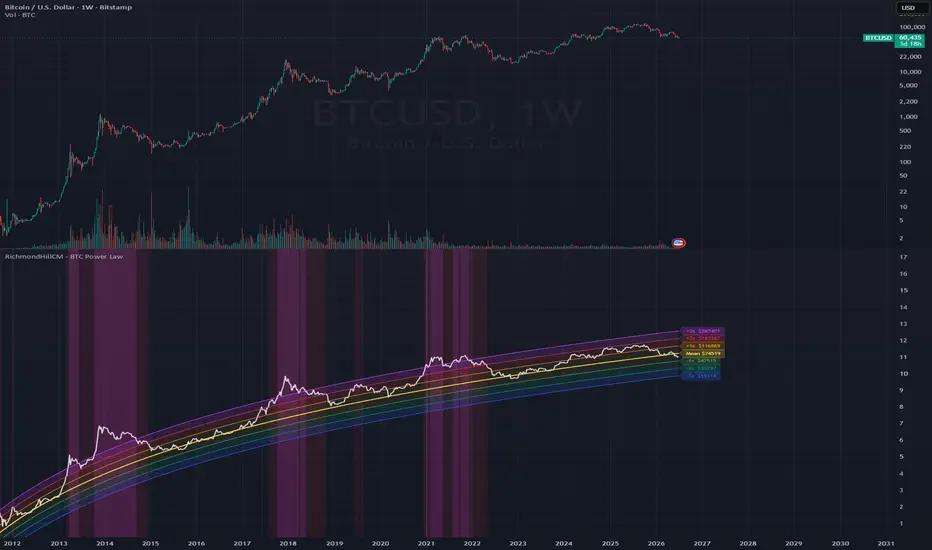
Bitcoin Power Law
The bands are plotted as ln(price) values in a separate pane.
On this pane the power-law mean and all sigma bands appear as
perfectly straight lines, because ln(price) = A*ln(days)+B is
linear in ln(days) -- but we plot against bar_index (linear time)
so the lines curve gently, correctly showing the power-law shape.
HOW TO USE:
1. Add this indicator to BTCUSD (any timeframe, weekly recommended)
2. It opens in its OWN pane below the main chart -- do NOT overlay
3. The pane Y-axis is ln(price) -- read the labels for USD levels
4. No log-scale toggle needed: the pane is already in log-price space
Genesis block: 3 January 2009 00:00 UTC
The bands are plotted as ln(price) values in a separate pane.
On this pane the power-law mean and all sigma bands appear as
perfectly straight lines, because ln(price) = A*ln(days)+B is
linear in ln(days) -- but we plot against bar_index (linear time)
so the lines curve gently, correctly showing the power-law shape.
HOW TO USE:
1. Add this indicator to BTCUSD (any timeframe, weekly recommended)
2. It opens in its OWN pane below the main chart -- do NOT overlay
3. The pane Y-axis is ln(price) -- read the labels for USD levels
4. No log-scale toggle needed: the pane is already in log-price space
Genesis block: 3 January 2009 00:00 UTC
Script open-source
Nello spirito di TradingView, l'autore di questo script lo ha reso open source, in modo che i trader possano esaminarne e verificarne la funzionalità. Complimenti all'autore! Sebbene sia possibile utilizzarlo gratuitamente, ricordiamo che la ripubblicazione del codice è soggetta al nostro Regolamento.

Declinazione di responsabilità
Le informazioni e le pubblicazioni non sono intese come, e non costituiscono, consulenza o raccomandazioni finanziarie, di investimento, di trading o di altro tipo fornite o approvate da TradingView. Per ulteriori informazioni, consultare i Termini di utilizzo.
Script open-source
Nello spirito di TradingView, l'autore di questo script lo ha reso open source, in modo che i trader possano esaminarne e verificarne la funzionalità. Complimenti all'autore! Sebbene sia possibile utilizzarlo gratuitamente, ricordiamo che la ripubblicazione del codice è soggetta al nostro Regolamento.
Declinazione di responsabilità
Le informazioni e le pubblicazioni non sono intese come, e non costituiscono, consulenza o raccomandazioni finanziarie, di investimento, di trading o di altro tipo fornite o approvate da TradingView. Per ulteriori informazioni, consultare i Termini di utilizzo.