Protected Highs & Lows
Protected Highs & Lows
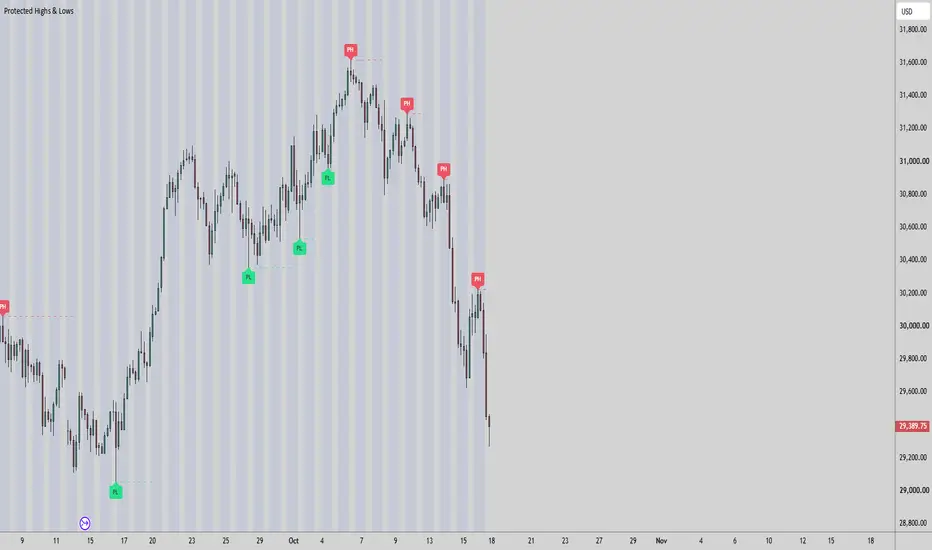
Marks the protected high and protected low of the current market structure on your chart.
How it works
In a downtrend, the protected high is the high price dropped from to make the latest break lower. In an uptrend, the protected low is the low price rose from to make the latest break higher. A level is set when price closes beyond the last confirmed swing. If price closes through the protected level, the trend flips and a new protected level is set on the other side. If price keeps going in the same direction and closes beyond the next swing extreme, the protected level moves further out.
Swing candle rule
The candle that makes the swing only counts toward the protected level if its own high or low formed after the opposite extreme. This indicator checks that with 1 minute data. On a 1m chart or lower there is no finer data to check with, so the swing candle's own extreme is left out.
What you see
PH (red) sits on the candle that made each protected high. PL (green) sits on each protected low. A dashed line runs from that candle to the bar where the level was set. The last 40 levels on each side are kept.
Hunting setups off the levels
The protected levels give you the structure to hunt entries from. When price closes through a protected level, structure has shifted and that is the cue to start looking for a setup in the new direction. A close below a protected low flips the trend bearish, so you look for shorts on a pullback up toward the new protected high. A close above a protected high flips it bullish, so you look for longs on a pullback down toward the new protected low. The level that just formed also gives you a clear invalidation point. If price closes back through it, the idea is wrong.
Combine it with whatever you already trade, like fib retracements, order blocks or a higher timeframe bias. The indicator only marks structure and doesn't enter trades for you.
Settings
Left Bars and Right Bars control how swings are detected (both 5 by default). The right bars are the confirmation lag, so a swing is only usable that many bars after it forms. Everything else is fixed.
Notes
Works on any symbol and timeframe. This is a market structure tool and is not a signal or trade advice.
Marks the protected high and protected low of the current market structure on your chart.
How it works
In a downtrend, the protected high is the high price dropped from to make the latest break lower. In an uptrend, the protected low is the low price rose from to make the latest break higher. A level is set when price closes beyond the last confirmed swing. If price closes through the protected level, the trend flips and a new protected level is set on the other side. If price keeps going in the same direction and closes beyond the next swing extreme, the protected level moves further out.
Swing candle rule
The candle that makes the swing only counts toward the protected level if its own high or low formed after the opposite extreme. This indicator checks that with 1 minute data. On a 1m chart or lower there is no finer data to check with, so the swing candle's own extreme is left out.
What you see
PH (red) sits on the candle that made each protected high. PL (green) sits on each protected low. A dashed line runs from that candle to the bar where the level was set. The last 40 levels on each side are kept.
Hunting setups off the levels
The protected levels give you the structure to hunt entries from. When price closes through a protected level, structure has shifted and that is the cue to start looking for a setup in the new direction. A close below a protected low flips the trend bearish, so you look for shorts on a pullback up toward the new protected high. A close above a protected high flips it bullish, so you look for longs on a pullback down toward the new protected low. The level that just formed also gives you a clear invalidation point. If price closes back through it, the idea is wrong.
Combine it with whatever you already trade, like fib retracements, order blocks or a higher timeframe bias. The indicator only marks structure and doesn't enter trades for you.
Settings
Left Bars and Right Bars control how swings are detected (both 5 by default). The right bars are the confirmation lag, so a swing is only usable that many bars after it forms. Everything else is fixed.
Notes
Works on any symbol and timeframe. This is a market structure tool and is not a signal or trade advice.

Declinazione di responsabilità
Le informazioni e le pubblicazioni non sono intese come, e non costituiscono, consulenza o raccomandazioni finanziarie, di investimento, di trading o di altro tipo fornite o approvate da TradingView. Per ulteriori informazioni, consultare i Termini di utilizzo.
Declinazione di responsabilità
Le informazioni e le pubblicazioni non sono intese come, e non costituiscono, consulenza o raccomandazioni finanziarie, di investimento, di trading o di altro tipo fornite o approvate da TradingView. Per ulteriori informazioni, consultare i Termini di utilizzo.