Liquidity Check: Is Your Stop Where Everyone's Is?
Is your stop (the price where you get out) sitting exactly where everyone else put theirs? This script checks it for you.
Why it helps you.
- You see if your stop sits near an obvious level, like a swing low or a round number.
- You see how often the price went past such levels on this chart and came back.
- You decide where your stop goes. The script only shows the facts.
What it shows. Your stop is the price where you get out if you are wrong. You type your stop price. The script tells you if it sits near an obvious level. Many traders put their stops at the same obvious levels. So the price often dips there, takes those stops, and comes back.
- One obvious level is the nearest low point that still holds. Its name is a swing low. A swing low is a low point with higher lows on both sides. "Still holds" (unbroken) means the price has not gone below it since.
- The other obvious level is the nearest round number, like 60,000.
- The script also counts how often, on this chart, the price went a little below such low points and then closed back above them.
- Example from our test. Data: Bybit BTCUSDT, 1 hour, 11,999 candles up to 2 Nov 2026. Stop 76,200, Buy. Your chart has its own numbers. The panel said three things:
- On this chart the price went below a low point 720 times.
- 498 times (69%) a candle closed back above it within 3 candles.
- 494 of those 498 times (99%) the price went at least 0.01 average candles below the low point. That is as far as the stop was.
What you see on the chart.
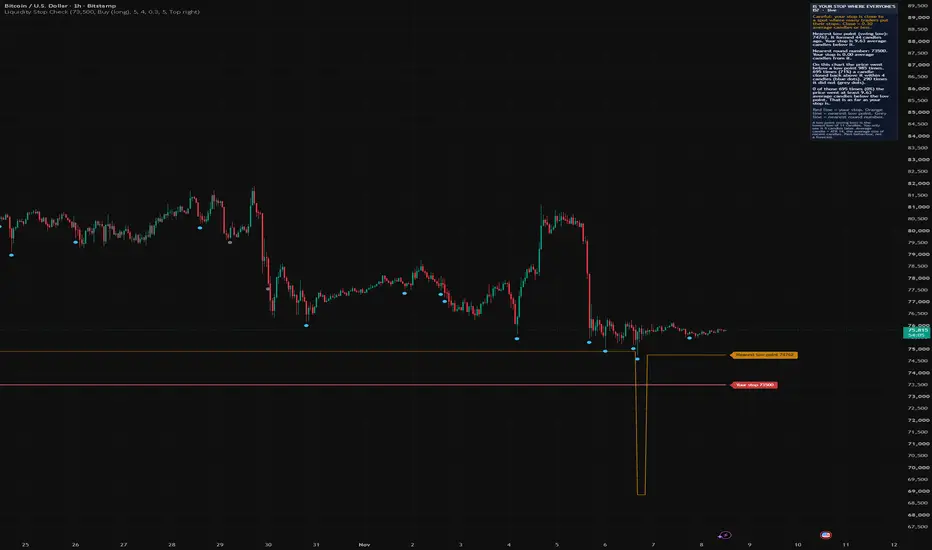
- Red line: your stop.
- Orange line: the nearest low point that still holds. The orange tag shows its price.
- Grey line: the nearest round number.
- Blue dot: the price went below a low point, and a candle closed back above it within 3 candles. The low point held.
- Grey dot: the price went below a low point and did not come back in time. The low point broke.
- A dot sits on the candle where this was decided. So it shows up a few candles after the dip.
- The panel: plain sentences about your stop. The most important sentence comes first.
How to use.
1. Type your stop price in the settings.
2. Choose "Buy (long)" if your stop is below the price, or "Sell (short)" if it is above.
3. Read the first sentence of the panel. It says if your stop is close to an obvious level.
4. Read how many dips on this chart went as far as your stop.
5. Use it to understand where your stop sits. It does not tell you where to put it.
6. Want a clean chart? Point at the script name on the chart, open the "More" menu and pick "Move tables to bottom". The panel then moves under the chart. You can also turn the dots off in the settings.
How it calculates.
- A candle is one bar on the chart. Average candle = ATR 14. ATR is the average size of recent candles.
- Swing low = the lowest low of 2n + 1 candles (n = 5, so 11 candles). You only see it n candles later.
- A swing level stays "unbroken" until the price trades below it.
- The first trade below an unbroken level is a poke. A poke is a short dip past the level.
- The poke is reclaimed if a candle closes back above the level within W candles. W is 3 by default, and the poke candle counts. If not, the level is broken.
- Depth of a reclaimed poke = how far the price went below the level, divided by ATR 14 of the candle before the poke.
- Your stop: the distance to the nearest unbroken swing level and to the nearest round number. It is measured in average candles (ATR 14).
- Near = within 0.3 average candles. You can change this.
- Round numbers: by default one tenth of the price's power of ten. So 1,000 at 60,000, and 0.000001 at 0.000012.
- Short trades use swing highs (high points) and mirror every rule.
What is different. Sweep and liquidity tools exist. Liquidity is how easy it is to trade at a price. This one is about your own stop, in plain sentences. Every share comes with the count n (how many cases were counted). No signals, no verdict word.
Repainting. Repainting means a value changes after it was shown. Every value of a closed candle uses that candle and earlier ones only. It never changes. A swing is known only n candles after it formed, and the script says so. On the open candle a poke can appear and disappear until the candle closes.
Limits.
- The counts come from one chart, looking back.
- The price often goes past a swing level and comes back, even on random data. So a high reclaimed share is not a sign of hidden orders.
- Round numbers are only marked as "near". They are not counted.
- Your stop is a number from the settings. It is not read from your broker.
- Past behaviour, not a forecast. Not financial advice.
Why you can still trust it. Every share comes with its count n from your chart. Price pokes past levels even on random data, and the limits above say so.
Make it a habit. After you set your stop, check it here once before you enter.
Data Window. Stop, ATR 14, nearest unbroken swing level and its age. Stop distance past the level. Nearest round number and its distance, near flag. Levels traded through, reclaimed, broken, reclaimed %. Reclaimed pokes as deep as your stop (count and %).
Open source (MPL 2.0).
Why it helps you.
- You see if your stop sits near an obvious level, like a swing low or a round number.
- You see how often the price went past such levels on this chart and came back.
- You decide where your stop goes. The script only shows the facts.
What it shows. Your stop is the price where you get out if you are wrong. You type your stop price. The script tells you if it sits near an obvious level. Many traders put their stops at the same obvious levels. So the price often dips there, takes those stops, and comes back.
- One obvious level is the nearest low point that still holds. Its name is a swing low. A swing low is a low point with higher lows on both sides. "Still holds" (unbroken) means the price has not gone below it since.
- The other obvious level is the nearest round number, like 60,000.
- The script also counts how often, on this chart, the price went a little below such low points and then closed back above them.
- Example from our test. Data: Bybit BTCUSDT, 1 hour, 11,999 candles up to 2 Nov 2026. Stop 76,200, Buy. Your chart has its own numbers. The panel said three things:
- On this chart the price went below a low point 720 times.
- 498 times (69%) a candle closed back above it within 3 candles.
- 494 of those 498 times (99%) the price went at least 0.01 average candles below the low point. That is as far as the stop was.
What you see on the chart.
- Red line: your stop.
- Orange line: the nearest low point that still holds. The orange tag shows its price.
- Grey line: the nearest round number.
- Blue dot: the price went below a low point, and a candle closed back above it within 3 candles. The low point held.
- Grey dot: the price went below a low point and did not come back in time. The low point broke.
- A dot sits on the candle where this was decided. So it shows up a few candles after the dip.
- The panel: plain sentences about your stop. The most important sentence comes first.
How to use.
1. Type your stop price in the settings.
2. Choose "Buy (long)" if your stop is below the price, or "Sell (short)" if it is above.
3. Read the first sentence of the panel. It says if your stop is close to an obvious level.
4. Read how many dips on this chart went as far as your stop.
5. Use it to understand where your stop sits. It does not tell you where to put it.
6. Want a clean chart? Point at the script name on the chart, open the "More" menu and pick "Move tables to bottom". The panel then moves under the chart. You can also turn the dots off in the settings.
How it calculates.
- A candle is one bar on the chart. Average candle = ATR 14. ATR is the average size of recent candles.
- Swing low = the lowest low of 2n + 1 candles (n = 5, so 11 candles). You only see it n candles later.
- A swing level stays "unbroken" until the price trades below it.
- The first trade below an unbroken level is a poke. A poke is a short dip past the level.
- The poke is reclaimed if a candle closes back above the level within W candles. W is 3 by default, and the poke candle counts. If not, the level is broken.
- Depth of a reclaimed poke = how far the price went below the level, divided by ATR 14 of the candle before the poke.
- Your stop: the distance to the nearest unbroken swing level and to the nearest round number. It is measured in average candles (ATR 14).
- Near = within 0.3 average candles. You can change this.
- Round numbers: by default one tenth of the price's power of ten. So 1,000 at 60,000, and 0.000001 at 0.000012.
- Short trades use swing highs (high points) and mirror every rule.
What is different. Sweep and liquidity tools exist. Liquidity is how easy it is to trade at a price. This one is about your own stop, in plain sentences. Every share comes with the count n (how many cases were counted). No signals, no verdict word.
Repainting. Repainting means a value changes after it was shown. Every value of a closed candle uses that candle and earlier ones only. It never changes. A swing is known only n candles after it formed, and the script says so. On the open candle a poke can appear and disappear until the candle closes.
Limits.
- The counts come from one chart, looking back.
- The price often goes past a swing level and comes back, even on random data. So a high reclaimed share is not a sign of hidden orders.
- Round numbers are only marked as "near". They are not counted.
- Your stop is a number from the settings. It is not read from your broker.
- Past behaviour, not a forecast. Not financial advice.
Why you can still trust it. Every share comes with its count n from your chart. Price pokes past levels even on random data, and the limits above say so.
Make it a habit. After you set your stop, check it here once before you enter.
Data Window. Stop, ATR 14, nearest unbroken swing level and its age. Stop distance past the level. Nearest round number and its distance, near flag. Levels traded through, reclaimed, broken, reclaimed %. Reclaimed pokes as deep as your stop (count and %).
Open source (MPL 2.0).

Declinazione di responsabilità
Le informazioni e le pubblicazioni non sono intese come, e non costituiscono, consulenza o raccomandazioni finanziarie, di investimento, di trading o di altro tipo fornite o approvate da TradingView. Per ulteriori informazioni, consultare i Termini di utilizzo.
Declinazione di responsabilità
Le informazioni e le pubblicazioni non sono intese come, e non costituiscono, consulenza o raccomandazioni finanziarie, di investimento, di trading o di altro tipo fornite o approvate da TradingView. Per ulteriori informazioni, consultare i Termini di utilizzo.