OPEN-SOURCE SCRIPT
Fibonacci vs Random Ratios: Where Pullbacks Actually Stop
WHAT IT DOES
Fibonacci retracement levels are drawn on charts every day, with the claim that pullbacks stop near 0.236, 0.382, 0.5, 0.618 or 0.786 of the previous swing. This indicator counts whether they do. It builds swings from pivot highs and lows, measures how deep each pullback went as a fraction of the leg before it, and checks how often that depth lands within a tolerance of a Fibonacci level. Then it asks the question the chart never asks: would five ratios picked at random do as well? It builds twenty sets of random ratios with the same tolerance, measures their hit rates on the same pullbacks, and reports how many random sets match or beat the Fibonacci levels.
WHAT IS ORIGINAL HERE
Scripts that report Fibonacci statistics usually show how often each level is reached. That number means little on its own: any set of five ratios with a tolerance around each catches a share of pullbacks, and a random walk produces pullbacks at every depth. This indicator supplies the missing comparison. Each random set covers exactly as much of the depth range as the five levels do, so the only thing that differs is where the ratios sit. If many random sets do as well as Fibonacci, the levels are not special on this chart; if none do, they are.
HOW IT IS MEASURED
- Swings: pivot highs and lows with one length, confirmed that many bars after the pivot. Pivots alternate; a new pivot of the same type as the last one replaces it only when it is more extreme.
- Pullback depth: for an up leg from a low to a high, the next low divides the drop by the leg; for a down leg, the next high divides the rise by the leg. A depth of 1 or more is a full retrace and is excluded. Depths between 0 and 1 are tested.
- Fibonacci hit: the depth lies within the tolerance (default 0.02) of any enabled level.
- Random baseline: twenty or more seeded sets of as many ratios as there are enabled levels, each ratio uniform between 0.2 and 0.8, spaced at least two tolerances apart so the windows never overlap. A random hit is a depth within the tolerance of any ratio of that set. The same pullbacks, the same tolerance, the same union test.
- Statistics: Fibonacci hits and rate with a 95% interval, random mean, minimum and maximum, the number of random sets with a rate at least equal to Fibonacci's, the difference in percentage points, a reference rate for uniformly distributed depths, and the depth distribution in five bins. Counters move only on confirmed pivots.
HOW TO USE IT
1. Open any time-based chart. The defaults suit an hourly chart with a few years of history: pivot length 10, tolerance 0.02, all five levels on, 20 random sets.
2. Read the "Random sets >= fib" row. "fib not special" means at least a tenth of the random sets did as well as the levels; "fib ahead" means fewer than one in twenty did; "borderline" lies between.
3. Compare the Fibonacci rate with the random mean. A difference inside the interval is noise.
4. Change the pivot length and the tolerance and watch both rates move together. Raise the tolerance to 0.05: both rates should rise by about the same amount. Change the seed: the random mean should barely move.
HOW TO READ THE TABLE
Header: symbol, timeframe, pivot length, tolerance, levels on.
Pullbacks: pullbacks tested, full retraces excluded, bars counted.
Fib hits: hits, rate, 95% interval.
Random ratios: number of sets, ratios per set, mean rate, minimum and maximum.
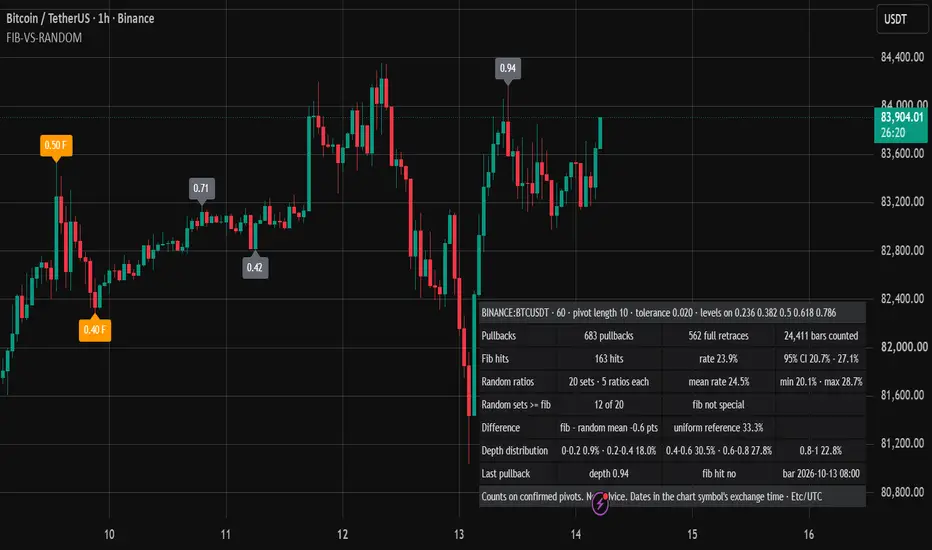
Random sets >= fib: how many random sets matched or beat the levels, and the verdict.
Difference: Fibonacci rate minus the random mean, and the reference rate for a uniform depth.
Depth distribution: share of pullbacks in each fifth of the leg.
Last pullback: its depth, whether it was a Fibonacci hit, and the bar where it ended. Labels mark the last pullbacks on the chart with their depth and an F for a hit.
LIMITATIONS
- The pivot length defines the swings. A different length gives different swings and different numbers.
- The tolerance sets the base rate for the levels and the random ratios alike; it is capped at 0.05 because the closest levels are 0.118 apart.
- The test says nothing about what price does after a touch, only where pullbacks stop.
- A random walk produces touches at any level by chance; that is exactly what the baseline measures.
- Only loaded bars are counted, so history depth, symbol and timeframe change every number. Counts, not a trading rule. Not financial advice.
The chart shows BINANCE:BTCUSDT on the 1 hour timeframe with the default settings. The table is in the bottom right.
Fibonacci retracement levels are drawn on charts every day, with the claim that pullbacks stop near 0.236, 0.382, 0.5, 0.618 or 0.786 of the previous swing. This indicator counts whether they do. It builds swings from pivot highs and lows, measures how deep each pullback went as a fraction of the leg before it, and checks how often that depth lands within a tolerance of a Fibonacci level. Then it asks the question the chart never asks: would five ratios picked at random do as well? It builds twenty sets of random ratios with the same tolerance, measures their hit rates on the same pullbacks, and reports how many random sets match or beat the Fibonacci levels.
WHAT IS ORIGINAL HERE
Scripts that report Fibonacci statistics usually show how often each level is reached. That number means little on its own: any set of five ratios with a tolerance around each catches a share of pullbacks, and a random walk produces pullbacks at every depth. This indicator supplies the missing comparison. Each random set covers exactly as much of the depth range as the five levels do, so the only thing that differs is where the ratios sit. If many random sets do as well as Fibonacci, the levels are not special on this chart; if none do, they are.
HOW IT IS MEASURED
- Swings: pivot highs and lows with one length, confirmed that many bars after the pivot. Pivots alternate; a new pivot of the same type as the last one replaces it only when it is more extreme.
- Pullback depth: for an up leg from a low to a high, the next low divides the drop by the leg; for a down leg, the next high divides the rise by the leg. A depth of 1 or more is a full retrace and is excluded. Depths between 0 and 1 are tested.
- Fibonacci hit: the depth lies within the tolerance (default 0.02) of any enabled level.
- Random baseline: twenty or more seeded sets of as many ratios as there are enabled levels, each ratio uniform between 0.2 and 0.8, spaced at least two tolerances apart so the windows never overlap. A random hit is a depth within the tolerance of any ratio of that set. The same pullbacks, the same tolerance, the same union test.
- Statistics: Fibonacci hits and rate with a 95% interval, random mean, minimum and maximum, the number of random sets with a rate at least equal to Fibonacci's, the difference in percentage points, a reference rate for uniformly distributed depths, and the depth distribution in five bins. Counters move only on confirmed pivots.
HOW TO USE IT
1. Open any time-based chart. The defaults suit an hourly chart with a few years of history: pivot length 10, tolerance 0.02, all five levels on, 20 random sets.
2. Read the "Random sets >= fib" row. "fib not special" means at least a tenth of the random sets did as well as the levels; "fib ahead" means fewer than one in twenty did; "borderline" lies between.
3. Compare the Fibonacci rate with the random mean. A difference inside the interval is noise.
4. Change the pivot length and the tolerance and watch both rates move together. Raise the tolerance to 0.05: both rates should rise by about the same amount. Change the seed: the random mean should barely move.
HOW TO READ THE TABLE
Header: symbol, timeframe, pivot length, tolerance, levels on.
Pullbacks: pullbacks tested, full retraces excluded, bars counted.
Fib hits: hits, rate, 95% interval.
Random ratios: number of sets, ratios per set, mean rate, minimum and maximum.
Random sets >= fib: how many random sets matched or beat the levels, and the verdict.
Difference: Fibonacci rate minus the random mean, and the reference rate for a uniform depth.
Depth distribution: share of pullbacks in each fifth of the leg.
Last pullback: its depth, whether it was a Fibonacci hit, and the bar where it ended. Labels mark the last pullbacks on the chart with their depth and an F for a hit.
LIMITATIONS
- The pivot length defines the swings. A different length gives different swings and different numbers.
- The tolerance sets the base rate for the levels and the random ratios alike; it is capped at 0.05 because the closest levels are 0.118 apart.
- The test says nothing about what price does after a touch, only where pullbacks stop.
- A random walk produces touches at any level by chance; that is exactly what the baseline measures.
- Only loaded bars are counted, so history depth, symbol and timeframe change every number. Counts, not a trading rule. Not financial advice.
The chart shows BINANCE:BTCUSDT on the 1 hour timeframe with the default settings. The table is in the bottom right.
Script open-source
Nello spirito di TradingView, l'autore di questo script lo ha reso open source, in modo che i trader possano esaminarne e verificarne la funzionalità. Complimenti all'autore! Sebbene sia possibile utilizzarlo gratuitamente, ricordiamo che la ripubblicazione del codice è soggetta al nostro Regolamento.

Custom Pine Script v6: indicators, strategies, alerts, with look-ahead and repaint checks. Backtest audits in Python.
Hire me on Upwork: upwork.com/freelancers/~01fa3c5136b53674c8
Proofs on GitHub: github.com/guillemustafa-ux
Hire me on Upwork: upwork.com/freelancers/~01fa3c5136b53674c8
Proofs on GitHub: github.com/guillemustafa-ux
Declinazione di responsabilità
Le informazioni e le pubblicazioni non sono intese come, e non costituiscono, consulenza o raccomandazioni finanziarie, di investimento, di trading o di altro tipo fornite o approvate da TradingView. Per ulteriori informazioni, consultare i Termini di utilizzo.
Script open-source
Nello spirito di TradingView, l'autore di questo script lo ha reso open source, in modo che i trader possano esaminarne e verificarne la funzionalità. Complimenti all'autore! Sebbene sia possibile utilizzarlo gratuitamente, ricordiamo che la ripubblicazione del codice è soggetta al nostro Regolamento.
Custom Pine Script v6: indicators, strategies, alerts, with look-ahead and repaint checks. Backtest audits in Python.
Hire me on Upwork: upwork.com/freelancers/~01fa3c5136b53674c8
Proofs on GitHub: github.com/guillemustafa-ux
Hire me on Upwork: upwork.com/freelancers/~01fa3c5136b53674c8
Proofs on GitHub: github.com/guillemustafa-ux
Declinazione di responsabilità
Le informazioni e le pubblicazioni non sono intese come, e non costituiscono, consulenza o raccomandazioni finanziarie, di investimento, di trading o di altro tipo fornite o approvate da TradingView. Per ulteriori informazioni, consultare i Termini di utilizzo.