OPEN-SOURCE SCRIPT
Mag7 + SPY Multi-Decade Seasonality
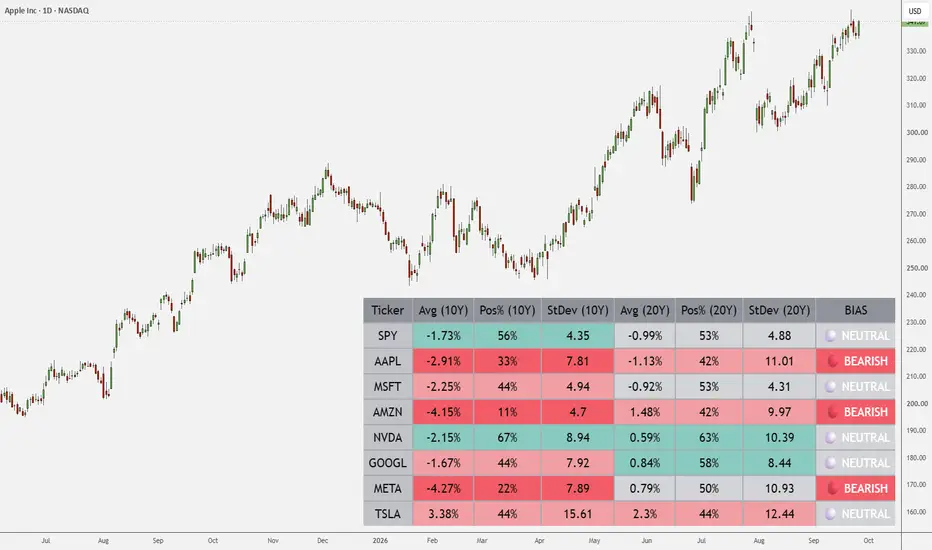
📊 Overview
The Mag7 + SPY Seasonal Dashboard tracks historical monthly seasonality across the Magnificent 7 (AAPL, MSFT, AMZN, NVDA, GOOGL, META, TSLA) and the SPY benchmark.
It dynamically pulls monthly timeframe data (1M) for the current calendar month and calculates multi-period historical metrics over 10-Year and 20-Year lookback windows.
⚙️ Key Tracked Metrics:
- Avg Return (Avg): Average historical percentage return for the current calendar month.
- Win Rate (Pos%): Percentage of historical years where the current month closed positive.
- Volatility (StDev): Standard deviation of historical monthly returns for dispersion analysis.
- Institutional BIAS:
🟢 BULLISH: Pos% (10Y) $\ge$ 70% AND Pos% (20Y) $\ge$ 60%.
🔴 BEARISH: Pos% (10Y) $\le$ 40% OR Pos% (20Y) $\le$ 40%.
⚪ NEUTRAL: Mixed or balanced historical performance.
🎯 How to Use:
- Apply the indicator overlay to any chart (the dashboard uses fixed 1M security requests, so chart timeframe won't alter the table).
- Scan the BIAS column for strong cross-period alignment between the 10-year and 20-year windows.
- Combine directional seasonal bias with technical market structure and intraday execution triggers.
The Mag7 + SPY Seasonal Dashboard tracks historical monthly seasonality across the Magnificent 7 (AAPL, MSFT, AMZN, NVDA, GOOGL, META, TSLA) and the SPY benchmark.
It dynamically pulls monthly timeframe data (1M) for the current calendar month and calculates multi-period historical metrics over 10-Year and 20-Year lookback windows.
⚙️ Key Tracked Metrics:
- Avg Return (Avg): Average historical percentage return for the current calendar month.
- Win Rate (Pos%): Percentage of historical years where the current month closed positive.
- Volatility (StDev): Standard deviation of historical monthly returns for dispersion analysis.
- Institutional BIAS:
🟢 BULLISH: Pos% (10Y) $\ge$ 70% AND Pos% (20Y) $\ge$ 60%.
🔴 BEARISH: Pos% (10Y) $\le$ 40% OR Pos% (20Y) $\le$ 40%.
⚪ NEUTRAL: Mixed or balanced historical performance.
🎯 How to Use:
- Apply the indicator overlay to any chart (the dashboard uses fixed 1M security requests, so chart timeframe won't alter the table).
- Scan the BIAS column for strong cross-period alignment between the 10-year and 20-year windows.
- Combine directional seasonal bias with technical market structure and intraday execution triggers.
Script open-source
Nello spirito di TradingView, l'autore di questo script lo ha reso open source, in modo che i trader possano esaminarne e verificarne la funzionalità. Complimenti all'autore! Sebbene sia possibile utilizzarlo gratuitamente, ricordiamo che la ripubblicazione del codice è soggetta al nostro Regolamento.

Declinazione di responsabilità
Le informazioni e le pubblicazioni non sono intese come, e non costituiscono, consulenza o raccomandazioni finanziarie, di investimento, di trading o di altro tipo fornite o approvate da TradingView. Per ulteriori informazioni, consultare i Termini di utilizzo.
Script open-source
Nello spirito di TradingView, l'autore di questo script lo ha reso open source, in modo che i trader possano esaminarne e verificarne la funzionalità. Complimenti all'autore! Sebbene sia possibile utilizzarlo gratuitamente, ricordiamo che la ripubblicazione del codice è soggetta al nostro Regolamento.
Declinazione di responsabilità
Le informazioni e le pubblicazioni non sono intese come, e non costituiscono, consulenza o raccomandazioni finanziarie, di investimento, di trading o di altro tipo fornite o approvate da TradingView. Per ulteriori informazioni, consultare i Termini di utilizzo.