OPEN-SOURCE SCRIPT
Aggiornato Daily Volume Profile Pro [WillyAlgoTrader]
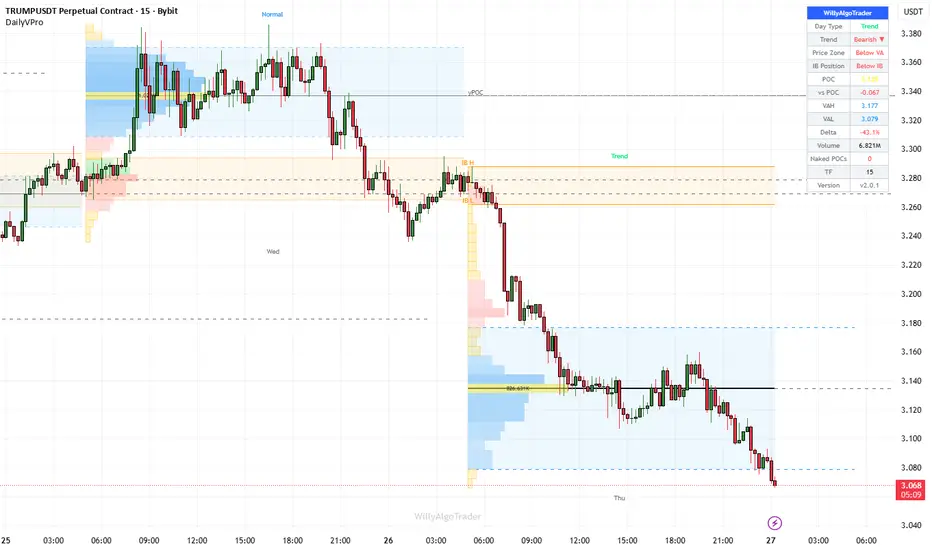
📊 Daily Volume Profile Pro is an overlay indicator that builds a complete volume profile for each daily session — distributing volume across price bins using candle-range proportional allocation, computing POC (Point of Control), 70% Value Area (VAH/VAL) using the CME expansion method, session VWAP, buy/sell delta per bin, and displaying up to 7 days of profiles simultaneously. The indicator also detects naked (unvisited) POCs from prior days, classifies each day's profile shape (Normal/Trend/Neutral/Double Distribution), tracks Initial Balance ranges, and highlights single-print thin-volume zones — creating a complete volume-based market context tool.
🧩 WHY THESE COMPONENTS WORK TOGETHER
A volume profile alone shows where trading activity concentrated — but without context, you don't know whether the profile represents a trending day, a balanced day, or a double-distribution day. You don't know whether the POC from two days ago was ever revisited. You don't know whether the current price is above or below the Initial Balance — which tells you whether the opening range has been broken.
This indicator layers multiple volume-based analyses that each answer a different question:
Volume Profile → WHERE did volume concentrate? Which prices are accepted (high volume) and rejected (low volume)?
POC → What is the single most-traded price? This is the market's "fair value" for that session.
Value Area (70%) → Where did 70% of volume trade? Price inside VA = balance. Price outside VA = imbalance seeking new value.
Delta Coloring → At each price level, was the activity dominated by buyers or sellers? Green bins = buying pressure, red = selling.
Naked POCs → Which prior-day fair values were never revisited? These are strong magnets — price tends to return to unfinished business.
Initial Balance → What was the opening range? Price above IB High = bullish conviction. Below IB Low = bearish. Inside = balance.
Day Type → What shape is the profile? Trend days (narrow) behave differently than Normal (bell curve) or Double Distribution (bimodal) days.
Single Prints → Where did price move too fast for volume to fill? These thin-volume zones are gaps in the profile that often get revisited.
No single component provides a complete picture. The combination tells you: the market's fair value (POC), the accepted range (VA), the directional pressure (delta), the day's character (day type), the opening bias (IB), unfinished levels from prior sessions (naked POCs), and price imbalances (single prints) — all from volume data.
🔍 WHAT MAKES IT ORIGINAL
1️⃣ Candle-range proportional volume allocation.
Each candle's volume is distributed across the price bins it touches, proportional to the overlap between the candle's range and each bin:
overlap = max(0, min(candle_high, bin_high) − max(candle_low, bin_low))
allocated_volume = total_volume × overlap / candle_range
This produces a smoother, more accurate profile than the common approach of assigning all volume to a single price (close or typical price). A candle spanning 5 bins distributes its volume across all 5, weighted by how much of the candle falls in each bin.
Buy/sell classification: close ≥ open → buy candle (volume added to buy array), close < open → sell candle (volume added to sell array). Delta coloring shows whether each bin was dominated by buying or selling pressure.
2️⃣ CME-style Value Area expansion.
The 70% Value Area is computed using the standard CME method:
— Start at POC bin
— Compare the volume of the next bin above vs the next bin below
— Expand toward whichever side has higher volume
— Repeat until 70% of total session volume is captured
— VAH = top of the highest included bin, VAL = bottom of the lowest included bin
This matches the industry-standard method used by CME Group and professional platforms. The VA is displayed as dashed lines (VAH/VAL) with an optional semi-transparent background fill.
3️⃣ Naked POC detection with historical scan.
For each prior day's POC, the indicator scans all bars from the POC's day to the present — checking whether price ever touched that level (low ≤ pocPrice ≤ high). If no bar has touched it, the POC is classified as "naked" (nPOC) and drawn as a dashed red line extending to the right.
Naked POCs represent unfinished business — the market established fair value at that price but never returned to retest it. They act as strong magnets because institutional activity that established the original POC may still hold positions anchored to that level. The scan limit is 300 bars to maintain performance.
4️⃣ Day type classification from profile shape.
Each day's volume distribution is analyzed to classify the session:
— Trend: significant bins < 35% of total bins — volume concentrated in a narrow area, price moved decisively in one direction
— Neutral: significant bins > 65% — volume spread evenly across the range, balanced/rotational day
— Normal: 35–65% — bell-curve distribution with clear POC and tapering tails
— DD (Double Distribution): significant bins concentrated in both top and bottom thirds but not the middle — bimodal distribution indicating two separate value areas (e.g., gap-and-go)
A "significant bin" is defined as having volume > 25% of POC volume. The classification appears as a color-coded label above each session.
5️⃣ Initial Balance (IB) range tracking.
The IB captures the high and low of the first N minutes of each session (configurable: 30, 60, 90, or 120 minutes). The IB range is drawn as solid lines with optional background fill, optionally extended to the end of session.
IB context: price above IB High signals that early buyers were committed and the market accepted higher prices — bullish bias. Price below IB Low signals the opposite. Price inside IB = range-bound session. The dashboard shows the current IB position (Above IB / Below IB / Inside IB).
6️⃣ Single print (thin volume) zone detection.
Bins with volume less than 15% of the POC bin's volume are classified as single prints — areas where price moved too quickly for significant volume to build. These are highlighted with a distinct border color and represent imbalance zones that often get revisited as the market seeks to fill the volume gap.
7️⃣ Multi-day profile display with configurable orientation.
Up to 7 days of profiles are drawn simultaneously with left or right orientation. Each day's profile bins are scaled proportionally: bin width = volume / maxVolume × span/3 in bars. The adaptive bin count adjusts to the day's price range: bins = min(binCountInput, max(8, range / (ATR × 0.05))).
8️⃣ POC extension + previous day POC (yPOC).
Each day's POC can be extended forward as a dashed line for 1–7 days (configurable), serving as a reference level for subsequent sessions. Yesterday's POC (yPOC) is drawn separately as a labeled reference — one of the most-watched volume levels in professional trading.
Today's POC, VAH, and VAL can be extended to the right chart edge for real-time reference.
9️⃣ Session VWAP.
Volume-weighted average price computed per session: VWAP = Σ(typicalPrice × volume) / Σ(volume). Displayed as a dotted line within each session. VWAP represents the average price at which volume traded — a key reference for institutional traders.
🔟 Optional MA overlay.
Six MA types available (SMA, EMA, RMA, WMA, VWMA, None) for additional trend context alongside the volume profile.
⚙️ HOW IT WORKS — CALCULATION FLOW
Step 1 — Session detection: Day change tracked via ta.change(time("D")). Session start/end bars, day high/low, and timestamps stored in arrays. IB high/low tracked during the first N minutes of each session.
Step 2 — Profile construction (per day): For each session, the price range is divided into bins. Every candle within the session distributes its volume across bins proportional to the candle-range overlap with each bin. Separate buy and sell arrays track directional volume.
Step 3 — POC/VA/VWAP: POC = bin with maximum volume. VA computed via CME expansion from POC until 70% captured. VWAP = cumulative (typical price × volume) / cumulative volume.
Step 4 — Visualization (last bar): All profiles, lines, and labels are drawn on barstate.islast using delete-and-redraw pattern. Profile boxes are colored by delta (buy/sell dominance), with POC bin highlighted, VA bins tinted, single prints bordered.
Step 5 — Naked POC scan: Each prior-day POC is checked against all subsequent bars. If no bar has touched the level → naked POC drawn as dashed line.
Step 6 — Day type: Volume distribution analyzed for shape classification (Trend/Normal/Neutral/DD).
📖 HOW TO USE
🎯 Quick start:
1. Add the indicator to an intraday chart (1M–30M recommended)
2. Volume profiles appear for each daily session (up to 7 days)
3. Yellow horizontal line = POC (highest volume price)
4. Blue dashed lines = VAH / VAL (70% Value Area boundaries)
5. Red dashed lines = naked POCs from prior days (unvisited fair values)
6. Orange lines = Initial Balance high/low
👁️ Reading the chart:
— 🟡 Solid line = POC (session fair value)
— 🟡 Dashed line = extended POC (reference for future sessions)
— 🔴 Dashed line with "nPOC" label = naked POC (unvisited — strong magnet)
— 🟡 "yPOC" label = yesterday's POC
— 🔵 Dashed lines = VAH / VAL (70% Value Area boundaries)
— 🔵 Shaded zone = Value Area background
— 🟣 Dotted line = session VWAP
— 🟠 Solid lines = IB High / IB Low
— 🟠 Shaded zone = Initial Balance range
— 🟢 Profile bins = buying pressure (delta positive)
— 🔴 Profile bins = selling pressure (delta negative)
— 🟡 Bordered bins = single prints (thin volume — imbalance zones)
— Day type labels: Trend / Normal / Neutral / DD
📊 Dashboard fields:
— Day Type: profile shape classification (Trend / Normal / Neutral / DD)
— Trend: price vs POC (Bullish ▲ / Bearish ▼)
— Price Zone: Above VA / Inside VA / Below VA
— IB Position: Above IB / Inside IB / Below IB
— POC: today's price, vs POC distance
— VAH / VAL: Value Area boundaries
— Delta: net buy/sell percentage
— Volume: total session volume
— Naked POCs: count of unvisited prior-day POCs
🔧 Tuning guide:
— Profile too coarse: increase Profile Bins (30–40)
— Profile too granular: decrease Profile Bins (15–20)
— Want to see more history: increase Days to Show (up to 7)
— IB too narrow for your market: increase IB Period (90–120 min)
— Too many single prints: this is informational — they highlight real imbalances
⚙️ KEY SETTINGS REFERENCE
⚙️ Main:
— Days to Show (default 7): number of daily profiles (1–7)
— Profile Bins (default 34): resolution of volume distribution
📊 Profile:
— Delta Coloring (default On): color bins by buy/sell pressure
— Single Prints (default On): highlight low-volume imbalance zones (< 15% of POC)
— Profile Side (default Left): draw bars left or right of session
📏 Levels:
— POC (default On) with width and extension (1–7 days)
— Naked POCs (default On): unvisited prior-day POCs
— Value Area (default On) with background fill
— Session VWAP (default Off)
— Previous Day POC (default On): yPOC reference
— Extend Today (default On): extend current session levels to chart edge
🔲 Initial Balance:
— IB Period (default 60 min): 15–120 minutes
— IB Background (default On) / Extend IB Lines (default On)
🎨 Visual:
— Day separators, day labels (Mon–Sun), day type labels
— MA overlay: SMA/EMA/RMA/WMA/VWMA/None
— Auto / Dark / Light theme
🔔 Alerts
— 🟢 POC CROSS UP / 🔴 POC CROSS DOWN — price crosses today's POC
— ⬆️ VAH BREAK — price breaks above Value Area High
— ⬇️ VAL BREAK — price breaks below Value Area Low
All support plain text and JSON webhook format. Bar-close confirmed.
⚠️ IMPORTANT NOTES
— 📐 Use on intraday timeframes. The indicator builds daily session profiles — it requires intraday data (1M–30M recommended) to produce meaningful volume distribution. On daily or higher timeframes, each day has only one candle, producing a single-bin profile.
— 🚫 No repainting. All alert conditions require barstate.isconfirmed. Profiles are computed from historical data within each session. Today's profile updates in real-time as new bars arrive (this is expected behavior for a live volume profile — not repainting).
— 📊 The volume allocation is proportional to candle-range overlap, not tick-by-tick. True tick data is not available in Pine Script. This candle-range method produces a close approximation for intraday timeframes (1M–15M). Lower timeframes = more candles per session = more accurate profile.
— ⚖️ The Value Area uses the standard CME expansion method: start at POC, expand toward higher-volume adjacent bins until 70% captured. This matches the industry-standard algorithm used by professional platforms.
— 🔴 Naked POC scan checks up to 300 bars of history per POC for performance reasons. On very low timeframes with many bars per day, a POC from 5+ days ago may exceed the scan range.
— 📏 Single prints are defined as bins with volume < 15% of POC volume — these represent areas where price moved too quickly for meaningful volume to accumulate. They are not errors or missing data.
— 🏷️ Day type classification uses volume distribution shape analysis based on the ratio of significant bins to total bins. It's a probabilistic assessment of the session's character, not a definitive market prediction.
— 🛠️ This is a volume analysis and market context tool, not an automated trading system. It visualizes where volume traded, which prices are accepted/rejected, and which levels remain unfinished — trade decisions remain yours.
— 🌐 Requires volume data. On instruments without reliable volume (some forex pairs), the profile accuracy depends on broker-reported tick volume.
🧩 WHY THESE COMPONENTS WORK TOGETHER
A volume profile alone shows where trading activity concentrated — but without context, you don't know whether the profile represents a trending day, a balanced day, or a double-distribution day. You don't know whether the POC from two days ago was ever revisited. You don't know whether the current price is above or below the Initial Balance — which tells you whether the opening range has been broken.
This indicator layers multiple volume-based analyses that each answer a different question:
Volume Profile → WHERE did volume concentrate? Which prices are accepted (high volume) and rejected (low volume)?
POC → What is the single most-traded price? This is the market's "fair value" for that session.
Value Area (70%) → Where did 70% of volume trade? Price inside VA = balance. Price outside VA = imbalance seeking new value.
Delta Coloring → At each price level, was the activity dominated by buyers or sellers? Green bins = buying pressure, red = selling.
Naked POCs → Which prior-day fair values were never revisited? These are strong magnets — price tends to return to unfinished business.
Initial Balance → What was the opening range? Price above IB High = bullish conviction. Below IB Low = bearish. Inside = balance.
Day Type → What shape is the profile? Trend days (narrow) behave differently than Normal (bell curve) or Double Distribution (bimodal) days.
Single Prints → Where did price move too fast for volume to fill? These thin-volume zones are gaps in the profile that often get revisited.
No single component provides a complete picture. The combination tells you: the market's fair value (POC), the accepted range (VA), the directional pressure (delta), the day's character (day type), the opening bias (IB), unfinished levels from prior sessions (naked POCs), and price imbalances (single prints) — all from volume data.
🔍 WHAT MAKES IT ORIGINAL
1️⃣ Candle-range proportional volume allocation.
Each candle's volume is distributed across the price bins it touches, proportional to the overlap between the candle's range and each bin:
overlap = max(0, min(candle_high, bin_high) − max(candle_low, bin_low))
allocated_volume = total_volume × overlap / candle_range
This produces a smoother, more accurate profile than the common approach of assigning all volume to a single price (close or typical price). A candle spanning 5 bins distributes its volume across all 5, weighted by how much of the candle falls in each bin.
Buy/sell classification: close ≥ open → buy candle (volume added to buy array), close < open → sell candle (volume added to sell array). Delta coloring shows whether each bin was dominated by buying or selling pressure.
2️⃣ CME-style Value Area expansion.
The 70% Value Area is computed using the standard CME method:
— Start at POC bin
— Compare the volume of the next bin above vs the next bin below
— Expand toward whichever side has higher volume
— Repeat until 70% of total session volume is captured
— VAH = top of the highest included bin, VAL = bottom of the lowest included bin
This matches the industry-standard method used by CME Group and professional platforms. The VA is displayed as dashed lines (VAH/VAL) with an optional semi-transparent background fill.
3️⃣ Naked POC detection with historical scan.
For each prior day's POC, the indicator scans all bars from the POC's day to the present — checking whether price ever touched that level (low ≤ pocPrice ≤ high). If no bar has touched it, the POC is classified as "naked" (nPOC) and drawn as a dashed red line extending to the right.
Naked POCs represent unfinished business — the market established fair value at that price but never returned to retest it. They act as strong magnets because institutional activity that established the original POC may still hold positions anchored to that level. The scan limit is 300 bars to maintain performance.
4️⃣ Day type classification from profile shape.
Each day's volume distribution is analyzed to classify the session:
— Trend: significant bins < 35% of total bins — volume concentrated in a narrow area, price moved decisively in one direction
— Neutral: significant bins > 65% — volume spread evenly across the range, balanced/rotational day
— Normal: 35–65% — bell-curve distribution with clear POC and tapering tails
— DD (Double Distribution): significant bins concentrated in both top and bottom thirds but not the middle — bimodal distribution indicating two separate value areas (e.g., gap-and-go)
A "significant bin" is defined as having volume > 25% of POC volume. The classification appears as a color-coded label above each session.
5️⃣ Initial Balance (IB) range tracking.
The IB captures the high and low of the first N minutes of each session (configurable: 30, 60, 90, or 120 minutes). The IB range is drawn as solid lines with optional background fill, optionally extended to the end of session.
IB context: price above IB High signals that early buyers were committed and the market accepted higher prices — bullish bias. Price below IB Low signals the opposite. Price inside IB = range-bound session. The dashboard shows the current IB position (Above IB / Below IB / Inside IB).
6️⃣ Single print (thin volume) zone detection.
Bins with volume less than 15% of the POC bin's volume are classified as single prints — areas where price moved too quickly for significant volume to build. These are highlighted with a distinct border color and represent imbalance zones that often get revisited as the market seeks to fill the volume gap.
7️⃣ Multi-day profile display with configurable orientation.
Up to 7 days of profiles are drawn simultaneously with left or right orientation. Each day's profile bins are scaled proportionally: bin width = volume / maxVolume × span/3 in bars. The adaptive bin count adjusts to the day's price range: bins = min(binCountInput, max(8, range / (ATR × 0.05))).
8️⃣ POC extension + previous day POC (yPOC).
Each day's POC can be extended forward as a dashed line for 1–7 days (configurable), serving as a reference level for subsequent sessions. Yesterday's POC (yPOC) is drawn separately as a labeled reference — one of the most-watched volume levels in professional trading.
Today's POC, VAH, and VAL can be extended to the right chart edge for real-time reference.
9️⃣ Session VWAP.
Volume-weighted average price computed per session: VWAP = Σ(typicalPrice × volume) / Σ(volume). Displayed as a dotted line within each session. VWAP represents the average price at which volume traded — a key reference for institutional traders.
🔟 Optional MA overlay.
Six MA types available (SMA, EMA, RMA, WMA, VWMA, None) for additional trend context alongside the volume profile.
⚙️ HOW IT WORKS — CALCULATION FLOW
Step 1 — Session detection: Day change tracked via ta.change(time("D")). Session start/end bars, day high/low, and timestamps stored in arrays. IB high/low tracked during the first N minutes of each session.
Step 2 — Profile construction (per day): For each session, the price range is divided into bins. Every candle within the session distributes its volume across bins proportional to the candle-range overlap with each bin. Separate buy and sell arrays track directional volume.
Step 3 — POC/VA/VWAP: POC = bin with maximum volume. VA computed via CME expansion from POC until 70% captured. VWAP = cumulative (typical price × volume) / cumulative volume.
Step 4 — Visualization (last bar): All profiles, lines, and labels are drawn on barstate.islast using delete-and-redraw pattern. Profile boxes are colored by delta (buy/sell dominance), with POC bin highlighted, VA bins tinted, single prints bordered.
Step 5 — Naked POC scan: Each prior-day POC is checked against all subsequent bars. If no bar has touched the level → naked POC drawn as dashed line.
Step 6 — Day type: Volume distribution analyzed for shape classification (Trend/Normal/Neutral/DD).
📖 HOW TO USE
🎯 Quick start:
1. Add the indicator to an intraday chart (1M–30M recommended)
2. Volume profiles appear for each daily session (up to 7 days)
3. Yellow horizontal line = POC (highest volume price)
4. Blue dashed lines = VAH / VAL (70% Value Area boundaries)
5. Red dashed lines = naked POCs from prior days (unvisited fair values)
6. Orange lines = Initial Balance high/low
👁️ Reading the chart:
— 🟡 Solid line = POC (session fair value)
— 🟡 Dashed line = extended POC (reference for future sessions)
— 🔴 Dashed line with "nPOC" label = naked POC (unvisited — strong magnet)
— 🟡 "yPOC" label = yesterday's POC
— 🔵 Dashed lines = VAH / VAL (70% Value Area boundaries)
— 🔵 Shaded zone = Value Area background
— 🟣 Dotted line = session VWAP
— 🟠 Solid lines = IB High / IB Low
— 🟠 Shaded zone = Initial Balance range
— 🟢 Profile bins = buying pressure (delta positive)
— 🔴 Profile bins = selling pressure (delta negative)
— 🟡 Bordered bins = single prints (thin volume — imbalance zones)
— Day type labels: Trend / Normal / Neutral / DD
📊 Dashboard fields:
— Day Type: profile shape classification (Trend / Normal / Neutral / DD)
— Trend: price vs POC (Bullish ▲ / Bearish ▼)
— Price Zone: Above VA / Inside VA / Below VA
— IB Position: Above IB / Inside IB / Below IB
— POC: today's price, vs POC distance
— VAH / VAL: Value Area boundaries
— Delta: net buy/sell percentage
— Volume: total session volume
— Naked POCs: count of unvisited prior-day POCs
🔧 Tuning guide:
— Profile too coarse: increase Profile Bins (30–40)
— Profile too granular: decrease Profile Bins (15–20)
— Want to see more history: increase Days to Show (up to 7)
— IB too narrow for your market: increase IB Period (90–120 min)
— Too many single prints: this is informational — they highlight real imbalances
⚙️ KEY SETTINGS REFERENCE
⚙️ Main:
— Days to Show (default 7): number of daily profiles (1–7)
— Profile Bins (default 34): resolution of volume distribution
📊 Profile:
— Delta Coloring (default On): color bins by buy/sell pressure
— Single Prints (default On): highlight low-volume imbalance zones (< 15% of POC)
— Profile Side (default Left): draw bars left or right of session
📏 Levels:
— POC (default On) with width and extension (1–7 days)
— Naked POCs (default On): unvisited prior-day POCs
— Value Area (default On) with background fill
— Session VWAP (default Off)
— Previous Day POC (default On): yPOC reference
— Extend Today (default On): extend current session levels to chart edge
🔲 Initial Balance:
— IB Period (default 60 min): 15–120 minutes
— IB Background (default On) / Extend IB Lines (default On)
🎨 Visual:
— Day separators, day labels (Mon–Sun), day type labels
— MA overlay: SMA/EMA/RMA/WMA/VWMA/None
— Auto / Dark / Light theme
🔔 Alerts
— 🟢 POC CROSS UP / 🔴 POC CROSS DOWN — price crosses today's POC
— ⬆️ VAH BREAK — price breaks above Value Area High
— ⬇️ VAL BREAK — price breaks below Value Area Low
All support plain text and JSON webhook format. Bar-close confirmed.
⚠️ IMPORTANT NOTES
— 📐 Use on intraday timeframes. The indicator builds daily session profiles — it requires intraday data (1M–30M recommended) to produce meaningful volume distribution. On daily or higher timeframes, each day has only one candle, producing a single-bin profile.
— 🚫 No repainting. All alert conditions require barstate.isconfirmed. Profiles are computed from historical data within each session. Today's profile updates in real-time as new bars arrive (this is expected behavior for a live volume profile — not repainting).
— 📊 The volume allocation is proportional to candle-range overlap, not tick-by-tick. True tick data is not available in Pine Script. This candle-range method produces a close approximation for intraday timeframes (1M–15M). Lower timeframes = more candles per session = more accurate profile.
— ⚖️ The Value Area uses the standard CME expansion method: start at POC, expand toward higher-volume adjacent bins until 70% captured. This matches the industry-standard algorithm used by professional platforms.
— 🔴 Naked POC scan checks up to 300 bars of history per POC for performance reasons. On very low timeframes with many bars per day, a POC from 5+ days ago may exceed the scan range.
— 📏 Single prints are defined as bins with volume < 15% of POC volume — these represent areas where price moved too quickly for meaningful volume to accumulate. They are not errors or missing data.
— 🏷️ Day type classification uses volume distribution shape analysis based on the ratio of significant bins to total bins. It's a probabilistic assessment of the session's character, not a definitive market prediction.
— 🛠️ This is a volume analysis and market context tool, not an automated trading system. It visualizes where volume traded, which prices are accepted/rejected, and which levels remain unfinished — trade decisions remain yours.
— 🌐 Requires volume data. On instruments without reliable volume (some forex pairs), the profile accuracy depends on broker-reported tick volume.
Note di rilascio
DAILY VOLUME PROFILE PRO — MAJOR UPDATE v2.0.1 → v2.2.3🆕 NEW TRADING TOOLS
- Dalton's 80% Rule engine — detects a session opening outside yesterday's
Value Area followed by N consecutive closes back inside it, then signals
the expected traversal with the opposite VA boundary as target.
Dashboard status (Armed / Active → target) + dedicated alert with
direction and target price. Confirmation bars are configurable to fit
any timeframe.
- HVN / LVN levels — up to 3 significant High Volume Nodes (support/
resistance) and 3 Low Volume Nodes (fast-transit zones) of today's
developing profile, drawn as S/R lines. POC bin excluded by design.
- Initial Balance extensions — classic ×1.5 and ×2 breakout targets
(IB High/Low ± 0.5 and ± 1.0 of the IB range) for the current session.
- Naked POC alerts — "Tested" (level consumed by price) and "Proximity"
(first approach within N ticks, fires once per level).
- Value Shift — dashboard row comparing today's developing VA vs
yesterday's: Above / Below / Overlap ▲▼ / Inside / Outside. One-glance
trend-vs-rotation read.
- Open Context — dashboard row showing where the session opened relative
to yesterday's Value Area.
- Individual alertcondition() for every event (POC cross, VAH/VAL break,
nPOC tested, nPOC proximity, 80% Rule) — each selectable separately in
the TradingView alert dialog. The combined alert() stream with JSON
webhook format is still available.
🎯 ACCURACY FIXES
- Naked POC detection fully rewritten. Levels are now tracked
incrementally bar by bar: a POC is registered when its session closes
and removed on the first bar after that trades through it. The previous
scan could miss valid nPOCs entirely and had a 300-bar lookback limit —
both issues are gone.
- Initial Balance off-by-one fixed — a bar opening exactly at the IB
boundary was incorrectly included (a 60-min IB became 75 min on 15m
charts). IB duration is now exact on every timeframe.
- Value Area background coloring off-by-one fixed — one extra bin above
VAH was being shaded. VA bin bounds are now stored exactly, with no
floating-point math at draw time.
- "Profile Bins" input is now respected exactly (removed a hidden
adaptive reduction that silently lowered the bin count).
- Internal Pine v6 compliance fixes (ta.* call consistency under lazy
boolean evaluation) for stable, repeatable calculations.
🌍 FOREX & TIMEFRAME COMPATIBILITY
- TPO fallback — symbols without volume data (many forex/CFD feeds) now
build a time-based profile (each bar = 1 unit) instead of a broken one.
The dashboard indicates "TPO mode" automatically.
- Works on every sub-daily timeframe, including seconds charts — long
24h forex sessions no longer overflow history limits.
- Fixed RE10020 runtime error on 1–5m charts (forward-projected lines
exceeded TradingView's 500-bar future limit).
- On daily+ timeframes the indicator now shows a clear warning instead
of silently drawing nothing.
- IB auto-disables when the chart TF is longer than the IB period
(no more meaningless "first-bar IB" on 4H charts).
⚡ PERFORMANCE
- Completed sessions are now computed ONCE at session close and cached —
only the developing day recalculates in real time (~7× less work per
tick on low timeframes).
- New "Redraw Only on Bar Close" mode (Advanced) for 1s–1m charts with
very liquid symbols.
📌 NOTES
- Intraday POC/VA levels develop in real time; cross signals are
evaluated against the level as it stood on that bar — inherent to all
developing-profile tools.
- On sub-1m charts, forward line extensions are capped by TradingView's
500-bars-into-the-future platform limit.
- Best used below 1H. Recommended: 5m–15m for day trading, 1m for scalping.
Script open-source
Nello spirito di TradingView, l'autore di questo script lo ha reso open source, in modo che i trader possano esaminarne e verificarne la funzionalità. Complimenti all'autore! Sebbene sia possibile utilizzarlo gratuitamente, ricordiamo che la ripubblicazione del codice è soggetta al nostro Regolamento.

10 years in trading. For all inquiries, contact me on my Telegram channel: t.me/WillyAlgoTrader or Instagram: @willytraderbtc
Declinazione di responsabilità
Le informazioni e le pubblicazioni non sono intese come, e non costituiscono, consulenza o raccomandazioni finanziarie, di investimento, di trading o di altro tipo fornite o approvate da TradingView. Per ulteriori informazioni, consultare i Termini di utilizzo.
Script open-source
Nello spirito di TradingView, l'autore di questo script lo ha reso open source, in modo che i trader possano esaminarne e verificarne la funzionalità. Complimenti all'autore! Sebbene sia possibile utilizzarlo gratuitamente, ricordiamo che la ripubblicazione del codice è soggetta al nostro Regolamento.
10 years in trading. For all inquiries, contact me on my Telegram channel: t.me/WillyAlgoTrader or Instagram: @willytraderbtc
Declinazione di responsabilità
Le informazioni e le pubblicazioni non sono intese come, e non costituiscono, consulenza o raccomandazioni finanziarie, di investimento, di trading o di altro tipo fornite o approvate da TradingView. Per ulteriori informazioni, consultare i Termini di utilizzo.