MarketProfile HL
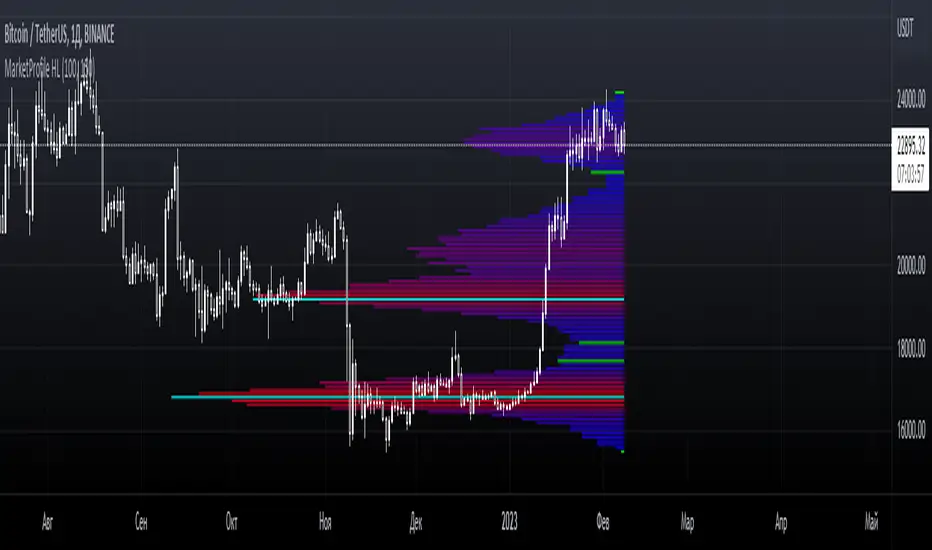
The gradient color of the levels shows where more or less horizontal volume accumulates.
Adapts to any timeframe or instrument.
Customizable display of horizontal levels HL and POC.
The HL and POC levels protrude beyond the boundaries of the main histogram on the right for a more convenient determination of dynamic centers and accumulation boundaries.
-------------------------------------------
MarketProfile HL динамически рассчитывает и отображает боковую гистограмму распределения объемов с цветами по градиенту, которая настроена на заданное количество свечей. Гистограмма накладывается на свечи, чтобы визуально представить области рыночного баланса и дисбаланса. Индикатор использует концепции статистического распределения и основан на теории профиля рынка.
Градиентный цвет уровней показывает, где накапливается больше или меньше горизонтального объема.
Адаптируется к любому таймфрейму или инструменту.
Настраиваемое отображение горизонтальных уровней HL и POC.
Уровни HL и POC выступают за границы основной гистограммы справа для более удобного определения динамических центров и границ накоплений.
Settings are simplified for faster configuration.
-------------------------------------------
Полное обновление индикатора с новой логикой расчета и оптимизацией. Цвета фиксированы и обновляются для правильного градиента. Уровни POC и HL показывают правильную длину и соответствуют фактическим накоплениям.
Настройки упрощены для более быстрой навигации.
The color display system was redesigned. Flexible customization is now available. You can customize the histogram gradient, including color transitions, as well as separately set the color of the central accumulation zone and its edges. This allows the visual component of the indicator to be tailored to personal preferences, the chart theme, and the analysis tasks, and also makes the accumulation structure more visually clear.
A histogram Shift parameter has been added. This allows the histogram to be moved away from the candlesticks, simplifying visual analysis and reducing overlapping elements on the chart. The histogram can be effectively locked to the right edge if the chart remains stationary, which is especially convenient for detailed analysis of the current situation without scrolling.
Script su invito
Solo gli utenti approvati dall'autore possono accedere a questo script. Per utilizzarlo, è necessario richiedere e ottenere l'autorizzazione. In genere, tale autorizzazione viene concessa dopo il pagamento. Per ulteriori dettagli, segui le istruzioni dell'autore riportate di seguito oppure contatta direttamente CryptoLevels.
TradingView NON consiglia di acquistare o utilizzare uno script a meno che non si abbia piena fiducia nel suo autore e se ne comprenda il funzionamento. È inoltre possibile trovare alternative gratuite e open source nei nostri script della community.
Istruzioni dell'autore

📅 Ежедневный анализ: t.me/cryptolevels_ru
Declinazione di responsabilità
Script su invito
Solo gli utenti approvati dall'autore possono accedere a questo script. Per utilizzarlo, è necessario richiedere e ottenere l'autorizzazione. In genere, tale autorizzazione viene concessa dopo il pagamento. Per ulteriori dettagli, segui le istruzioni dell'autore riportate di seguito oppure contatta direttamente CryptoLevels.
TradingView NON consiglia di acquistare o utilizzare uno script a meno che non si abbia piena fiducia nel suo autore e se ne comprenda il funzionamento. È inoltre possibile trovare alternative gratuite e open source nei nostri script della community.
Istruzioni dell'autore
📅 Ежедневный анализ: t.me/cryptolevels_ru