MTF Max/Min Delta Grid
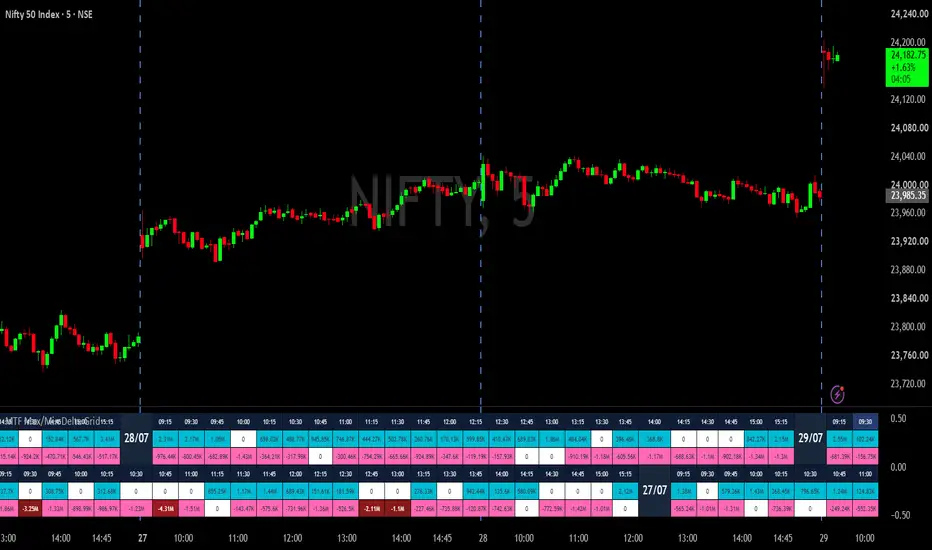
Description:
Overview
The Multi-Timeframe Max/Min Delta Grid is an advanced volume analysis tool designed to look inside the formation of a candle and extract the true buying and selling pressure. By utilizing a 1-second lower timeframe, this indicator calculates the raw intrabar volume delta and plots the absolute peak buying (Max Delta) and peak selling (Min Delta) pressure within a dynamic, multi-row heatmap table.
This tool is built for order flow and volume traders who want to identify hidden exhaustion, absorption, and aggressive participation without cluttering their main chart with traditional histograms.
How it Works (Underlying Logic)
Standard volume bars only tell you the total transacted volume at the end of a candle. This script goes deeper:
Micro-structure Tracking: It constantly queries the 1S (1-second) timeframe to calculate tick-by-tick Delta (Ask-traded volume vs. Bid-traded volume).
MTF Aggregation: It accumulates these 1-second delta values into a user-defined Higher Timeframe (e.g., a 5-minute block).
Extremes: Instead of just showing the closing delta, it isolates the highest positive delta (Max ▲) and lowest negative delta (Min ▼) achieved during the life of that candle.
The Heatmap Grid & Color Logic
To make data consumption intuitive, the indicator renders a clean, scrolling "Excel-like" grid anchored to the bottom right of the chart. The cells are dynamically color-coded based on the percentage of Max/Min Delta relative to the Total Volume of that specific timeframe:
White (<= 3%): Zero Threshold. When delta influence is negligible, the cell background turns white and forces a "0" reading to eliminate market noise.
Aqua / Pink (3% to 5%): Low Dominance. Highlights unusually weak buyer (Aqua) or seller (Pink) participation.
Green / Red Gradients (5% to 95%): Standard Scaling. The script uses a smooth color gradient. A 20% delta ratio will appear as a dark, muted green/red, while an 80% ratio will glow as a bright neon green/red, allowing your eyes to instantly gauge relative volume strength.
Dark Grid (>= 95%): Extreme Domination. If buyers or sellers completely overwhelm the bar, the cell turns distinctly dark, signaling an extreme imbalance.
Practical Application for Traders
Spotting Absorption: If price pushes into resistance and the grid prints a massive bright green Max Delta, but the candle ultimately closes as a bearish pin bar, it indicates aggressive buyers were absorbed by limit sellers.
Confirming Breakouts: A genuine breakout should be accompanied by a bright or dark-grid Max/Min Delta, confirming that aggressive market orders are supporting the move.
Exhaustion: Shrinking Max/Min Delta percentages (indicated by muted colors or White/Aqua/Pink thresholds) at swing highs/lows can signal a lack of interest and a potential reversal.
Features at a Glance
Smart Number Formatting: Converts large volume figures into readable formats (e.g., 15.4K, 1.2M) to keep the grid clean.
Auto Date Separators: Automatically inserts a dark blue date column whenever a new trading session/day begins, making historical review effortless.
Highly Customizable: Fully adjustable grid sizes (rows/columns), MTF selections, and adjustable percentage thresholds to fit varying asset classes and liquidities.
Disclaimer: This script is for educational and analytical purposes only. Volume delta is a leading context tool but should be combined with price action or other structural analysis methods. It does not guarantee profitable trading signals.
Overview
The Multi-Timeframe Max/Min Delta Grid is an advanced volume analysis tool designed to look inside the formation of a candle and extract the true buying and selling pressure. By utilizing a 1-second lower timeframe, this indicator calculates the raw intrabar volume delta and plots the absolute peak buying (Max Delta) and peak selling (Min Delta) pressure within a dynamic, multi-row heatmap table.
This tool is built for order flow and volume traders who want to identify hidden exhaustion, absorption, and aggressive participation without cluttering their main chart with traditional histograms.
How it Works (Underlying Logic)
Standard volume bars only tell you the total transacted volume at the end of a candle. This script goes deeper:
Micro-structure Tracking: It constantly queries the 1S (1-second) timeframe to calculate tick-by-tick Delta (Ask-traded volume vs. Bid-traded volume).
MTF Aggregation: It accumulates these 1-second delta values into a user-defined Higher Timeframe (e.g., a 5-minute block).
Extremes: Instead of just showing the closing delta, it isolates the highest positive delta (Max ▲) and lowest negative delta (Min ▼) achieved during the life of that candle.
The Heatmap Grid & Color Logic
To make data consumption intuitive, the indicator renders a clean, scrolling "Excel-like" grid anchored to the bottom right of the chart. The cells are dynamically color-coded based on the percentage of Max/Min Delta relative to the Total Volume of that specific timeframe:
White (<= 3%): Zero Threshold. When delta influence is negligible, the cell background turns white and forces a "0" reading to eliminate market noise.
Aqua / Pink (3% to 5%): Low Dominance. Highlights unusually weak buyer (Aqua) or seller (Pink) participation.
Green / Red Gradients (5% to 95%): Standard Scaling. The script uses a smooth color gradient. A 20% delta ratio will appear as a dark, muted green/red, while an 80% ratio will glow as a bright neon green/red, allowing your eyes to instantly gauge relative volume strength.
Dark Grid (>= 95%): Extreme Domination. If buyers or sellers completely overwhelm the bar, the cell turns distinctly dark, signaling an extreme imbalance.
Practical Application for Traders
Spotting Absorption: If price pushes into resistance and the grid prints a massive bright green Max Delta, but the candle ultimately closes as a bearish pin bar, it indicates aggressive buyers were absorbed by limit sellers.
Confirming Breakouts: A genuine breakout should be accompanied by a bright or dark-grid Max/Min Delta, confirming that aggressive market orders are supporting the move.
Exhaustion: Shrinking Max/Min Delta percentages (indicated by muted colors or White/Aqua/Pink thresholds) at swing highs/lows can signal a lack of interest and a potential reversal.
Features at a Glance
Smart Number Formatting: Converts large volume figures into readable formats (e.g., 15.4K, 1.2M) to keep the grid clean.
Auto Date Separators: Automatically inserts a dark blue date column whenever a new trading session/day begins, making historical review effortless.
Highly Customizable: Fully adjustable grid sizes (rows/columns), MTF selections, and adjustable percentage thresholds to fit varying asset classes and liquidities.
Disclaimer: This script is for educational and analytical purposes only. Volume delta is a leading context tool but should be combined with price action or other structural analysis methods. It does not guarantee profitable trading signals.

Declinazione di responsabilità
Le informazioni e le pubblicazioni non sono intese come, e non costituiscono, consulenza o raccomandazioni finanziarie, di investimento, di trading o di altro tipo fornite o approvate da TradingView. Per ulteriori informazioni, consultare i Termini di utilizzo.
Declinazione di responsabilità
Le informazioni e le pubblicazioni non sono intese come, e non costituiscono, consulenza o raccomandazioni finanziarie, di investimento, di trading o di altro tipo fornite o approvate da TradingView. Per ulteriori informazioni, consultare i Termini di utilizzo.