Geometric Price Time Square Projection - Ver 1.0
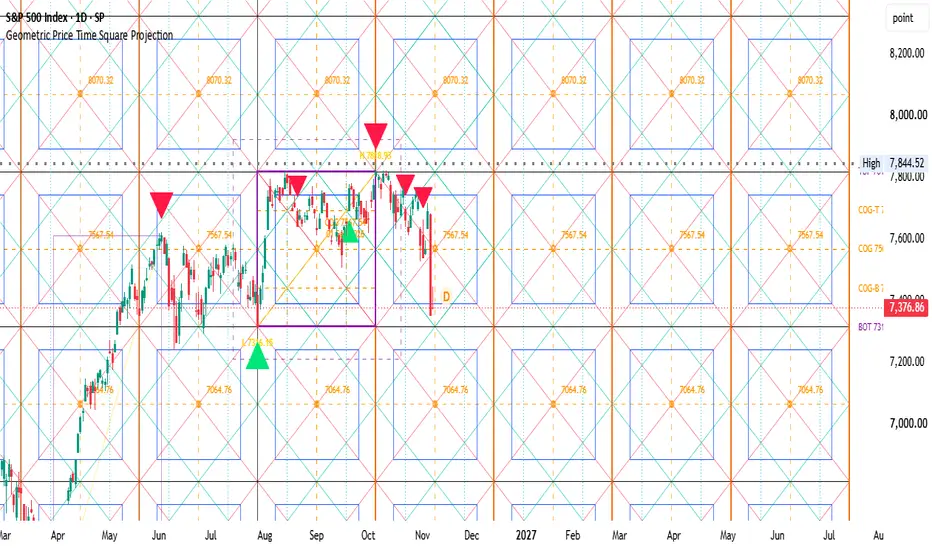
Geometric Price Time Square Projection — Ver 1.0
By Timepricedecoder
═══════════════════════════════════════════
█ OVERVIEW
═══════════════════════════════════════════
Turns one swing into a master square of price and time, then repeats it as a grid so you can see where price levels, angles and time cycles meet — on any chart, any market.
This indicator applies the Gann principle of squaring price and time, using Pythagorean geometry. Gann taught that price and time are two sides of one equation; when they balance, the market reaches a natural turning point.
• Side A (time) — number of bars in the master swing
• Side B (price) — range of the master swing (High − Low)
• The Square — A bars wide, B points high. Everything else is derived from it
The master square is taken once from closed bars and never moves. Its grid, diagonals, diamonds, quarter levels and time nodes are projected forward — a structured, geometry-based framework instead of arbitrary indicator levels.
When a time node + a price level + a diagonal arrive together, the market is squaring — and that is where the strongest signals appear.

═══════════════════════════════════════════
█ CORE CONCEPTS
═══════════════════════════════════════════
🟪 Master Square
Highest and lowest close of the last window of closed bars. Daily and above: your Gann number (44, 88 or 176 bars). Intraday: one trading session. Taken once per session or every N bars — it never repaints.
🔲 Harmonic Grid
The master repeats as columns (past + future) and rows (above + below). Every cell carries the same geometry — a natural map of support, resistance and time confluence.
📐 Inside Every Cell
• Diagonals (red) — the price/time angles of the square
• Inner square (blue) — side 1/√2, the largest square that fits inside the diamond
• Diamonds (teal) — the square rotated 45°. Styles: Diamond / Halves only (2×2 lattice) / Diamond + halves
• COG lines (orange dashed) — price centre and time middle
✂️ Quadrants
The master splits into 4 mid squares with quarter levels (¼, ½, ¾) and their own time nodes.
⏱ Time Nodes
• Full square — thick orange verticals. Major cycle markers
• ½ node — half the square width. Minor cycle marker
• q / q½ — cycles of the 4 mid squares
Past nodes mirror before the left edge. Labels show bars from the left edge and bars to go.
Presets: Pythagorean, Fibonacci, Gann fractions.
🔢 Swing Ratio
The info label shows bars, range, price per bar and the nearest Pythagorean ratio: 3-4-5, 4-3-5 or 1-1-√2.


═══════════════════════════════════════════
█ SIGNAL TIERS
═══════════════════════════════════════════
Every closed bar is scored on three components:
• TIME — reversal candle on a time node
• PRICE — rejection candle at a square level (base, top, COG, quarter lines)
• ANGLE — rejection candle on a diagonal
▲▼ Large triangle — all 3 agree. Strongest signal
▲▼ Small triangle — 2 of 3 agree. Moderate signal (default)
● Circle — 1 of 3. Weakest, hidden by default (Minimum confluence = 1)
🟢 Green below the bar = buy 🔴 Red above the bar = sell
A buy candle must close in the upper half of its range, a sell candle in the lower half.
═══════════════════════════════════════════
█ RECOMMENDED SETTINGS
═══════════════════════════════════════════
Scalping — Gann 44, Swing TF 3, chart 3m–5m
Intraday — Gann 88, Swing TF 10, chart 5m–15m
Swing / Positional — Gann 88 or 176 on Daily
Indices — Gann 88, Diamond style "Halves only", Min confluence 2
Session length — 375 NSE · 390 US stocks · 1440 crypto / forex
Grid — default 4 columns each side, 2 rows above / below. Reduce it to get diamonds in every cell (TradingView allows 500 lines per script)
These are starting points — adjust to your market and style.
═══════════════════════════════════════════
█ HOW TO USE
═══════════════════════════════════════════
1 — Let the script build the master square automatically
2 — Watch the thick orange verticals — the key time nodes
3 — Look for confluence: time node + level + diagonal in the same area
4 — Enter on triangle signals with your own candle confirmation
5 — Treat the grid as areas of interest, not exact targets
6 — The two cells after the master (right, and above) carry full diamonds — this is where the latest price action usually plays out
═══════════════════════════════════════════
█ DISCLAIMER
═══════════════════════════════════════════
This script is published for educational purposes only. It does not constitute financial advice. Past signal accuracy does not guarantee future results.
The master square and grid are built from closed bars and do not repaint; live signals fire on bar close. The optional swing high / low triangles and back-filled signals inside the master window are drawn when a master is created, so they are hindsight marks, not live signals — switch them off for strict real-time behaviour.
Always use proper risk management. Trade at your own risk.
By Timepricedecoder
═══════════════════════════════════════════
█ OVERVIEW
═══════════════════════════════════════════
Turns one swing into a master square of price and time, then repeats it as a grid so you can see where price levels, angles and time cycles meet — on any chart, any market.
This indicator applies the Gann principle of squaring price and time, using Pythagorean geometry. Gann taught that price and time are two sides of one equation; when they balance, the market reaches a natural turning point.
• Side A (time) — number of bars in the master swing
• Side B (price) — range of the master swing (High − Low)
• The Square — A bars wide, B points high. Everything else is derived from it
The master square is taken once from closed bars and never moves. Its grid, diagonals, diamonds, quarter levels and time nodes are projected forward — a structured, geometry-based framework instead of arbitrary indicator levels.
When a time node + a price level + a diagonal arrive together, the market is squaring — and that is where the strongest signals appear.
═══════════════════════════════════════════
█ CORE CONCEPTS
═══════════════════════════════════════════
🟪 Master Square
Highest and lowest close of the last window of closed bars. Daily and above: your Gann number (44, 88 or 176 bars). Intraday: one trading session. Taken once per session or every N bars — it never repaints.
🔲 Harmonic Grid
The master repeats as columns (past + future) and rows (above + below). Every cell carries the same geometry — a natural map of support, resistance and time confluence.
📐 Inside Every Cell
• Diagonals (red) — the price/time angles of the square
• Inner square (blue) — side 1/√2, the largest square that fits inside the diamond
• Diamonds (teal) — the square rotated 45°. Styles: Diamond / Halves only (2×2 lattice) / Diamond + halves
• COG lines (orange dashed) — price centre and time middle
✂️ Quadrants
The master splits into 4 mid squares with quarter levels (¼, ½, ¾) and their own time nodes.
⏱ Time Nodes
• Full square — thick orange verticals. Major cycle markers
• ½ node — half the square width. Minor cycle marker
• q / q½ — cycles of the 4 mid squares
Past nodes mirror before the left edge. Labels show bars from the left edge and bars to go.
Presets: Pythagorean, Fibonacci, Gann fractions.
🔢 Swing Ratio
The info label shows bars, range, price per bar and the nearest Pythagorean ratio: 3-4-5, 4-3-5 or 1-1-√2.
═══════════════════════════════════════════
█ SIGNAL TIERS
═══════════════════════════════════════════
Every closed bar is scored on three components:
• TIME — reversal candle on a time node
• PRICE — rejection candle at a square level (base, top, COG, quarter lines)
• ANGLE — rejection candle on a diagonal
▲▼ Large triangle — all 3 agree. Strongest signal
▲▼ Small triangle — 2 of 3 agree. Moderate signal (default)
● Circle — 1 of 3. Weakest, hidden by default (Minimum confluence = 1)
🟢 Green below the bar = buy 🔴 Red above the bar = sell
A buy candle must close in the upper half of its range, a sell candle in the lower half.
═══════════════════════════════════════════
█ RECOMMENDED SETTINGS
═══════════════════════════════════════════
Scalping — Gann 44, Swing TF 3, chart 3m–5m
Intraday — Gann 88, Swing TF 10, chart 5m–15m
Swing / Positional — Gann 88 or 176 on Daily
Indices — Gann 88, Diamond style "Halves only", Min confluence 2
Session length — 375 NSE · 390 US stocks · 1440 crypto / forex
Grid — default 4 columns each side, 2 rows above / below. Reduce it to get diamonds in every cell (TradingView allows 500 lines per script)
These are starting points — adjust to your market and style.
═══════════════════════════════════════════
█ HOW TO USE
═══════════════════════════════════════════
1 — Let the script build the master square automatically
2 — Watch the thick orange verticals — the key time nodes
3 — Look for confluence: time node + level + diagonal in the same area
4 — Enter on triangle signals with your own candle confirmation
5 — Treat the grid as areas of interest, not exact targets
6 — The two cells after the master (right, and above) carry full diamonds — this is where the latest price action usually plays out
═══════════════════════════════════════════
█ DISCLAIMER
═══════════════════════════════════════════
This script is published for educational purposes only. It does not constitute financial advice. Past signal accuracy does not guarantee future results.
The master square and grid are built from closed bars and do not repaint; live signals fire on bar close. The optional swing high / low triangles and back-filled signals inside the master window are drawn when a master is created, so they are hindsight marks, not live signals — switch them off for strict real-time behaviour.
Always use proper risk management. Trade at your own risk.

Declinazione di responsabilità
Le informazioni e le pubblicazioni non sono intese come, e non costituiscono, consulenza o raccomandazioni finanziarie, di investimento, di trading o di altro tipo fornite o approvate da TradingView. Per ulteriori informazioni, consultare i Termini di utilizzo.
Declinazione di responsabilità
Le informazioni e le pubblicazioni non sono intese come, e non costituiscono, consulenza o raccomandazioni finanziarie, di investimento, di trading o di altro tipo fornite o approvate da TradingView. Per ulteriori informazioni, consultare i Termini di utilizzo.