MA Envelope 15%
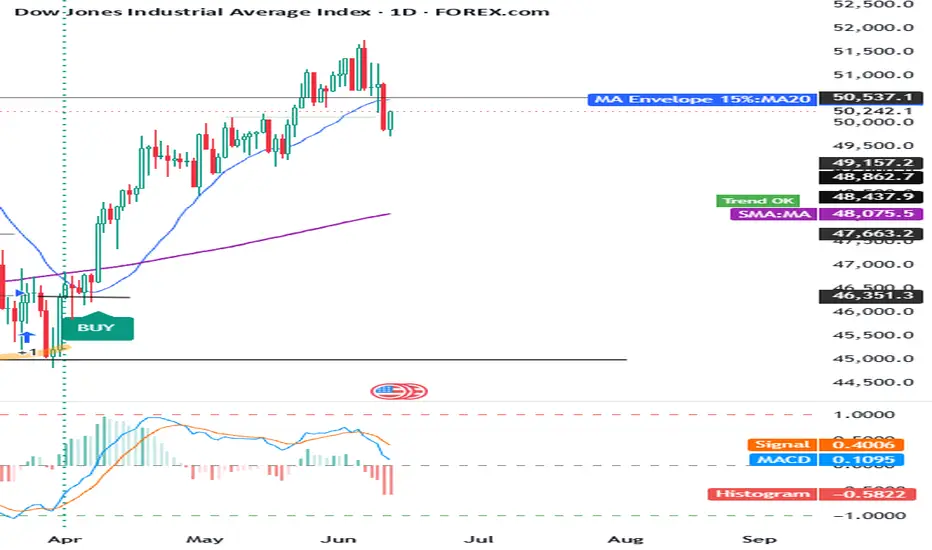
Traders use this type of indicator to identify extreme price deviations, potential mean reversion opportunities, and trend strength. When price moves near or beyond the upper band, it may suggest overextension or overbought conditions. When price approaches the lower band, it may indicate oversold conditions or potential value zones.
Overall, this indicator is a simple but effective way to visualize volatility boundaries around a trend and to support decision-making in trend-following or mean-reversion strategies.
You can adjust the % yourself according to your instrument.
Overall, this indicator is a simple but effective way to visualize volatility boundaries around a trend and to support decision-making in trend-following or mean-reversion strategies.
You can adjust the % yourself according to your instrument.

Declinazione di responsabilità
Le informazioni e le pubblicazioni non sono intese come, e non costituiscono, consulenza o raccomandazioni finanziarie, di investimento, di trading o di altro tipo fornite o approvate da TradingView. Per ulteriori informazioni, consultare i Termini di utilizzo.
Declinazione di responsabilità
Le informazioni e le pubblicazioni non sono intese come, e non costituiscono, consulenza o raccomandazioni finanziarie, di investimento, di trading o di altro tipo fornite o approvate da TradingView. Per ulteriori informazioni, consultare i Termini di utilizzo.