PT Zone Sniper - MTF Support/Resistance & FVG Retests
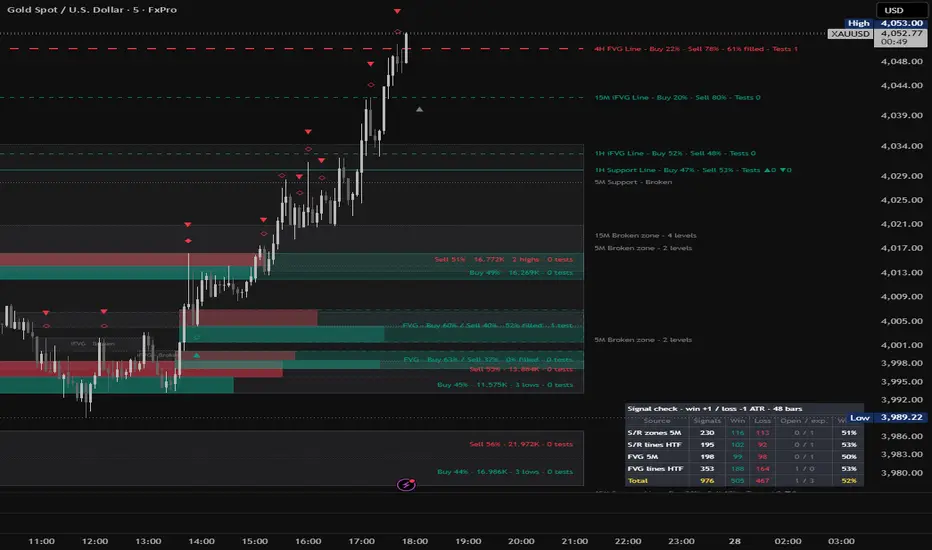
PT Zone Sniper - MTF Support/Resistance & FVG Retests
OVERVIEW
PT Zone Sniper maps the support and resistance zones where price has turned at least twice, shows who traded at those levels, marks every test, break and retest of a zone, and highlights where a trade could be taken. It also tracks Fair Value Gaps (FVG) and inverted FVGs (iFVG) with the same rules and visuals, and brings 4H, 1H and 15M levels onto the execution chart.
The default settings are tuned for gold (XAUUSD) on a 5-minute execution chart. The indicator works the same way on crypto (for example BTC and ETH) and other liquid markets; on those, review the tolerance and FVG filter settings described below.
All signals are calculated on closed candles. Higher-timeframe data is requested from the last confirmed higher-timeframe candle, so levels and signals do not repaint.
HOW IT WORKS
1. Zones from matching swings
A swing high (or low) is a candle that is higher (or lower) than the candles on each side of it (7 candles by default). A zone is created only when a new swing matches one of the last 3 swings on the same side within a tolerance (standard deviation of the close by default, or ATR). One-off spikes are therefore ignored: every zone is a level where price turned at least twice (double / triple tops and bottoms, including matches that are not back-to-back).
The outer edge of a zone is the extreme wick of the matching swings; the inner edge is the furthest open/high/low/close of those swing candles that still lies within the tolerance, so zones stay as thin as the candles allow.
2. Buy / sell volume balance
Each zone shows how much buying and selling volume formed it. On the chart timeframe this uses real up/down volume from lower-timeframe data (about chart timeframe / 10). By default only the candles around each swing are measured, which shows who defended the level. The zone shows a red bar (sell share) and a green bar (buy share), and the text "Buy 62% · 1.24K · 2 lows · 1 test" style figures: share, volume, the swings that formed the zone, and the number of tests.
3. Tests, breaks and retests
After a zone is confirmed, price must first move away (0.5 x ATR by default). The next time it enters the zone and closes back out on the zone's side, that is a test:
- Bounce (support) / rejection (resistance): outline diamond at the wick.
- Break: a candle closes beyond the far edge. The zone flips role (support becomes resistance and vice versa) and waits for a retest.
- Break & retest: price returns from the other side and holds. Filled diamond at the wick.
- If a flipped zone breaks again, it is finished and shown as a dotted grey "Broken" level until the end of the day.
Zone colours: grey until the first test (optional), green while acting as support, red while acting as resistance.
4. Higher-timeframe levels
The same engine runs on three higher timeframes (4H, 1H and 15M by default). Their zones are drawn on the execution chart as single lines with a label such as "4H Resistance Line - Buy 42% · Sell 58% - Tests ▲0 ▼2". Close lines of the same timeframe and role are grouped into one line, and close broken levels into one grey zone, to keep the chart readable.
5. Fair Value Gaps (FVG / iFVG)
A Fair Value Gap is a three-candle imbalance: the wicks of candle 1 and candle 3 do not overlap. Bullish FVGs act as support, bearish FVGs as resistance.
- Chart-timeframe FVGs must pass adjustable filters: minimum gap size, impulse candle size and body, and volume agreeing with the direction.
- The CE (50% midpoint) is drawn as a dotted line and used as the entry level. The part of the gap already filled fades, and the label shows "% filled".
- Respected: price reaches the CE and closes back on the FVG's side.
- Mitigated: the gap is completely filled without a close beyond it.
- Inverted (iFVG): a candle closes beyond the far edge; the gap flips role and waits for a retest from the other side.
- Finished FVGs stay as grey dotted boxes where they formed until the end of the day. 4H / 1H / 15M FVGs are shown as dashed lines at the CE and disappear once finished.
6. Entry arrows
- Grey arrow (pending): the nearest qualifying zone or FVG on each side of price, placed at the entry level (top of support, bottom of resistance, or the FVG's CE). It moves with price.
- Green up arrow / red down arrow (confirmed): placed under / over the candle where a qualifying zone or FVG was tested and held. The entry reference is that candle's close.
- A zone qualifies after one confirmed test in its current role, or once it has broken and flipped (break & retest setup). A fresh FVG qualifies immediately, and only its first 2 tests can produce arrows, because gaps weaken with every touch.
- An optional confluence filter can require a higher-timeframe line overlap, volume agreement, or an overlapping FVG.
7. Signal check panel
A small table follows every confirmed arrow on the loaded chart and counts a win if price moves 1 x ATR in the arrow's direction first, a loss if it moves 1 x ATR against it first (both in one candle counts as a loss), or expired after 48 bars. Results are split into S/R zones and FVGs on the chart timeframe and the higher timeframes. It is a measurement aid for your own chart, not a backtest: it ignores spreads, commissions and trade management, and past results do not predict future results.
HOW TO USE IT
- Use a 5-minute chart (15-minute also works). Leave the defaults on for gold.
- Before the session, note the higher-timeframe lines and the zones / FVGs nearest to price. Levels from several timeframes, or an FVG inside an S/R zone of the same role, are the strongest areas.
- Watch the grey pending arrows: they show the next buy and sell levels worth attention.
- When a green or red confirmed arrow prints, hover it and the zone label to check the buy / sell balance, number of tests, and whether it was a break & retest.
- Place your own stop beyond the far edge of the zone or gap and manage risk yourself. The indicator does not set stops or targets.
- Treat dotted grey "Broken" / "Mitigated" levels as finished.
- Alerts: create one alert with the condition "PT Zone Sniper -> Any alert() function call" to receive new zones, break & retests, confirmed entries and broken levels. Separate alert conditions are also available.
- For crypto: if zones look too wide or too frequent, switch "Tolerance based on" to ATR and tighten the FVG filters.
KEY SETTINGS
- Zone detection: time horizon, tolerance type and multiplier, number of swings compared, max zone age.
- Higher timeframe lines: three timeframes (4H / 1H / 15M), line level, grouping of close lines.
- Tests and signals: distance price must leave before a new test, break buffer, diamonds, end-of-day removal of broken levels.
- Entry arrows: pending reach, flipped-zone entries, confluence filter, alerts.
- Fair Value Gaps: on/off, chart / higher timeframes, iFVG tracking, tests allowed for arrows, fill shading, CE line.
- FVG filters (5M): minimum gap size, impulse size, body size, volume agreement, expiry.
- Volume balance: measured at touches or between swings, lower-timeframe granularity.
- Display filter: number of zones / lines / FVGs shown on each side of price, distance from price.
- Signal check panel: win / loss distances, expiry, position.
- Appearance: all colours and transparencies are adjustable.
WHAT MAKES IT DIFFERENT
- Zones require two or more matching swings instead of a single pivot, and show the swings that formed them separately from the tests that came after.
- Every zone carries its own buy / sell volume balance measured on the candles that defended it.
- Each zone follows a full life cycle (test, break, flip, retest, broken) with a separate count of bull and bear tests, instead of a static box.
- Support / resistance zones and Fair Value Gaps share one set of rules, colours, signals and alerts, so confluence between them is visible at a glance and can be used as an entry filter.
- Higher-timeframe levels and gaps are projected onto the execution chart without repainting, and grouped to avoid clutter.
- The built-in signal check panel lets you measure the confirmed arrows on your own symbol and timeframe.
LIMITATIONS
- Zones appear only after the second swing is confirmed (7 candles later on the chart timeframe), so they are drawn a little after the turn.
- Higher-timeframe buy / sell volume is estimated from candles, not real order flow.
- On spot gold and other CFD feeds, volume is broker tick volume; percentages are more meaningful than the raw amounts.
- Only the nearest zones, lines and FVGs are drawn by default; turn on "Show all zones" to inspect everything being tracked.
- Higher-timeframe levels reach back only as far as the loaded chart history.
- FVGs are a widely used trading concept, not a proven statistical edge.
- This indicator is a chart-reading and decision-support tool. It does not predict the future, and no signal is a recommendation to trade. Always use your own judgement and risk management.
OVERVIEW
PT Zone Sniper maps the support and resistance zones where price has turned at least twice, shows who traded at those levels, marks every test, break and retest of a zone, and highlights where a trade could be taken. It also tracks Fair Value Gaps (FVG) and inverted FVGs (iFVG) with the same rules and visuals, and brings 4H, 1H and 15M levels onto the execution chart.
The default settings are tuned for gold (XAUUSD) on a 5-minute execution chart. The indicator works the same way on crypto (for example BTC and ETH) and other liquid markets; on those, review the tolerance and FVG filter settings described below.
All signals are calculated on closed candles. Higher-timeframe data is requested from the last confirmed higher-timeframe candle, so levels and signals do not repaint.
HOW IT WORKS
1. Zones from matching swings
A swing high (or low) is a candle that is higher (or lower) than the candles on each side of it (7 candles by default). A zone is created only when a new swing matches one of the last 3 swings on the same side within a tolerance (standard deviation of the close by default, or ATR). One-off spikes are therefore ignored: every zone is a level where price turned at least twice (double / triple tops and bottoms, including matches that are not back-to-back).
The outer edge of a zone is the extreme wick of the matching swings; the inner edge is the furthest open/high/low/close of those swing candles that still lies within the tolerance, so zones stay as thin as the candles allow.
2. Buy / sell volume balance
Each zone shows how much buying and selling volume formed it. On the chart timeframe this uses real up/down volume from lower-timeframe data (about chart timeframe / 10). By default only the candles around each swing are measured, which shows who defended the level. The zone shows a red bar (sell share) and a green bar (buy share), and the text "Buy 62% · 1.24K · 2 lows · 1 test" style figures: share, volume, the swings that formed the zone, and the number of tests.
3. Tests, breaks and retests
After a zone is confirmed, price must first move away (0.5 x ATR by default). The next time it enters the zone and closes back out on the zone's side, that is a test:
- Bounce (support) / rejection (resistance): outline diamond at the wick.
- Break: a candle closes beyond the far edge. The zone flips role (support becomes resistance and vice versa) and waits for a retest.
- Break & retest: price returns from the other side and holds. Filled diamond at the wick.
- If a flipped zone breaks again, it is finished and shown as a dotted grey "Broken" level until the end of the day.
Zone colours: grey until the first test (optional), green while acting as support, red while acting as resistance.
4. Higher-timeframe levels
The same engine runs on three higher timeframes (4H, 1H and 15M by default). Their zones are drawn on the execution chart as single lines with a label such as "4H Resistance Line - Buy 42% · Sell 58% - Tests ▲0 ▼2". Close lines of the same timeframe and role are grouped into one line, and close broken levels into one grey zone, to keep the chart readable.
5. Fair Value Gaps (FVG / iFVG)
A Fair Value Gap is a three-candle imbalance: the wicks of candle 1 and candle 3 do not overlap. Bullish FVGs act as support, bearish FVGs as resistance.
- Chart-timeframe FVGs must pass adjustable filters: minimum gap size, impulse candle size and body, and volume agreeing with the direction.
- The CE (50% midpoint) is drawn as a dotted line and used as the entry level. The part of the gap already filled fades, and the label shows "% filled".
- Respected: price reaches the CE and closes back on the FVG's side.
- Mitigated: the gap is completely filled without a close beyond it.
- Inverted (iFVG): a candle closes beyond the far edge; the gap flips role and waits for a retest from the other side.
- Finished FVGs stay as grey dotted boxes where they formed until the end of the day. 4H / 1H / 15M FVGs are shown as dashed lines at the CE and disappear once finished.
6. Entry arrows
- Grey arrow (pending): the nearest qualifying zone or FVG on each side of price, placed at the entry level (top of support, bottom of resistance, or the FVG's CE). It moves with price.
- Green up arrow / red down arrow (confirmed): placed under / over the candle where a qualifying zone or FVG was tested and held. The entry reference is that candle's close.
- A zone qualifies after one confirmed test in its current role, or once it has broken and flipped (break & retest setup). A fresh FVG qualifies immediately, and only its first 2 tests can produce arrows, because gaps weaken with every touch.
- An optional confluence filter can require a higher-timeframe line overlap, volume agreement, or an overlapping FVG.
7. Signal check panel
A small table follows every confirmed arrow on the loaded chart and counts a win if price moves 1 x ATR in the arrow's direction first, a loss if it moves 1 x ATR against it first (both in one candle counts as a loss), or expired after 48 bars. Results are split into S/R zones and FVGs on the chart timeframe and the higher timeframes. It is a measurement aid for your own chart, not a backtest: it ignores spreads, commissions and trade management, and past results do not predict future results.
HOW TO USE IT
- Use a 5-minute chart (15-minute also works). Leave the defaults on for gold.
- Before the session, note the higher-timeframe lines and the zones / FVGs nearest to price. Levels from several timeframes, or an FVG inside an S/R zone of the same role, are the strongest areas.
- Watch the grey pending arrows: they show the next buy and sell levels worth attention.
- When a green or red confirmed arrow prints, hover it and the zone label to check the buy / sell balance, number of tests, and whether it was a break & retest.
- Place your own stop beyond the far edge of the zone or gap and manage risk yourself. The indicator does not set stops or targets.
- Treat dotted grey "Broken" / "Mitigated" levels as finished.
- Alerts: create one alert with the condition "PT Zone Sniper -> Any alert() function call" to receive new zones, break & retests, confirmed entries and broken levels. Separate alert conditions are also available.
- For crypto: if zones look too wide or too frequent, switch "Tolerance based on" to ATR and tighten the FVG filters.
KEY SETTINGS
- Zone detection: time horizon, tolerance type and multiplier, number of swings compared, max zone age.
- Higher timeframe lines: three timeframes (4H / 1H / 15M), line level, grouping of close lines.
- Tests and signals: distance price must leave before a new test, break buffer, diamonds, end-of-day removal of broken levels.
- Entry arrows: pending reach, flipped-zone entries, confluence filter, alerts.
- Fair Value Gaps: on/off, chart / higher timeframes, iFVG tracking, tests allowed for arrows, fill shading, CE line.
- FVG filters (5M): minimum gap size, impulse size, body size, volume agreement, expiry.
- Volume balance: measured at touches or between swings, lower-timeframe granularity.
- Display filter: number of zones / lines / FVGs shown on each side of price, distance from price.
- Signal check panel: win / loss distances, expiry, position.
- Appearance: all colours and transparencies are adjustable.
WHAT MAKES IT DIFFERENT
- Zones require two or more matching swings instead of a single pivot, and show the swings that formed them separately from the tests that came after.
- Every zone carries its own buy / sell volume balance measured on the candles that defended it.
- Each zone follows a full life cycle (test, break, flip, retest, broken) with a separate count of bull and bear tests, instead of a static box.
- Support / resistance zones and Fair Value Gaps share one set of rules, colours, signals and alerts, so confluence between them is visible at a glance and can be used as an entry filter.
- Higher-timeframe levels and gaps are projected onto the execution chart without repainting, and grouped to avoid clutter.
- The built-in signal check panel lets you measure the confirmed arrows on your own symbol and timeframe.
LIMITATIONS
- Zones appear only after the second swing is confirmed (7 candles later on the chart timeframe), so they are drawn a little after the turn.
- Higher-timeframe buy / sell volume is estimated from candles, not real order flow.
- On spot gold and other CFD feeds, volume is broker tick volume; percentages are more meaningful than the raw amounts.
- Only the nearest zones, lines and FVGs are drawn by default; turn on "Show all zones" to inspect everything being tracked.
- Higher-timeframe levels reach back only as far as the loaded chart history.
- FVGs are a widely used trading concept, not a proven statistical edge.
- This indicator is a chart-reading and decision-support tool. It does not predict the future, and no signal is a recommendation to trade. Always use your own judgement and risk management.

Declinazione di responsabilità
Le informazioni e le pubblicazioni non sono intese come, e non costituiscono, consulenza o raccomandazioni finanziarie, di investimento, di trading o di altro tipo fornite o approvate da TradingView. Per ulteriori informazioni, consultare i Termini di utilizzo.
Declinazione di responsabilità
Le informazioni e le pubblicazioni non sono intese come, e non costituiscono, consulenza o raccomandazioni finanziarie, di investimento, di trading o di altro tipo fornite o approvate da TradingView. Per ulteriori informazioni, consultare i Termini di utilizzo.