VIBE QSFM-00220347 S v1.0 Trailing SL Indicator Pine by Panduck
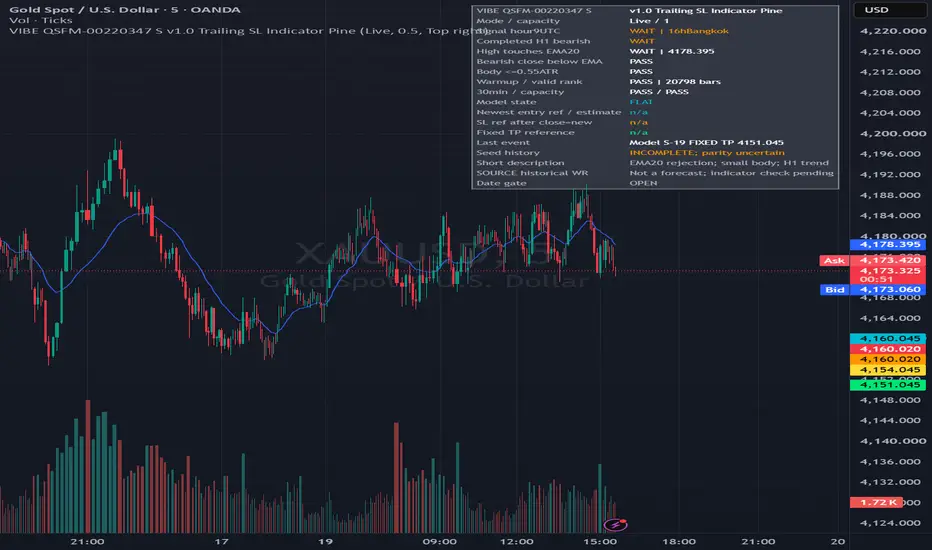
# VIBE QSFM-00220347 S v1.0 Trailing SL Indicator Pine
## What is ready
This is the SHORT EMA-rejection indicator for QSFM-00220347. It includes explanatory recreation comments, PREPARE, EXECUTE, MOVE SL and MODEL EXIT messages, historical confirmed markers, a filter/management table, configurable table location, display toggles and historical source-result notes.
User requested this indicator after reviewing the partial TradingView strategy result on October 19, 2026. The indicator still needs TradingView compilation and realtime alert checks. No broker orders or publication were performed.
## Install and choose the correct mode
1. Copy all text from **VIBE QSFM-00220347 S v1.0 Trailing SL Indicator Pine.pine** into a NEW indicator in TradingView Pine Editor. Save and add to **standard OANDA:XAUUSD, 5-minute candles**.
2. Choose **Live** for future signals. This is the default, has no signal end date and uses one virtual position at a time. Leave the live seed at June 3, 2026 for the initial comparison, and load sufficient history. Changing the seed changes initialization and potentially signals.
3. **Original backtest** mode is for historical checks: January 1, 2025 23:00 UTC to May 27, 2026 11:45 UTC, with original raw capacity 5. It allows up to five separate model positions and is not the Live capacity-1 workflow.
4. **Forward reference** mode is for the supplied June 3–October 16, 2026 historical comparison; its end is exclusive 09:10 UTC. It uses capacity 1 as an approximation to source safety filtering. This mode is expired for future signals; switch back to Live afterward.
5. This is an indicator, so its historical calculations use available chart bars. It does not inherit a Strategy Report's Deep Backtesting data range. Incomplete seed coverage is shown in the table; at least 241 source bars must load before signals qualify. Full original history is needed to compare original EMA/virtual-position paths accurately.
## Set up alerts
Create **ONE** TradingView alert with this indicator selected and **Any alert() function call** as the condition. Enable your chosen phone/app/sound notifications, choose expiration, then create it. All four event types are enabled by default and identified in their messages; use the indicator input toggles to select which events you want.
Do not create duplicate alerts for the same enabled event set. Alert frequency is handled by the script: PREPARE at most once per developing candle, other events at confirmed candle close. Different event types or different model trade IDs can legitimately occur on the same close, especially in historical capacity-5 mode.
Delete and recreate the alert after code, input, symbol or timeframe changes. TradingView saves a server copy of the alert's script and settings. Changing the chart does not update that copy. Alerts only fire on realtime bars; historical markers do not send past notifications. [Official alert documentation](tradingview.com/pine-script-docs/concepts/alerts/).
## What each message means
**PREPARE — provisional:** the current candle touches the developing EMA20, is bearish with body within 0.55 ATR, and its close is no higher than EMA20 + $0.50 (adjustable prepare tolerance), while other current filters, cooldown and model capacity pass. The candle is unfinished and may cancel. Do not enter just because PREPARE appears. This threshold is only an early notification, not a modification of the tested entry rule.
**EXECUTE — confirmed:** the finished candle satisfies ALL source rules, including close strictly below EMA20. Enter on the next available candle if taking the signal. PREPARE is not a prerequisite; EXECUTE can arrive without an earlier heads-up. The message estimates entry/SL/TP from the decision close; the actual next open and your broker fill may differ.
**MOVE SL — next bar:** a surviving completed candle lowers that model trade's stop. The message identifies its S-number and leaves TP fixed. The tool cannot amend your broker stop.
**MODEL EXIT:** the finished chart candle touched the model's existing stop or fixed target. It is not proof your broker closed the trade. Broker protection should execute when hit; do not wait for a candle-close message to respect it.
Signals use candle OPEN times 09:00–09:59 UTC on UTC weekdays. Their confirmed close/execute times are **09:05–10:00 UTC, or 16:05–17:00 Bangkok**. A 17:00 Bangkok execution can therefore be valid.
## TP is fixed; only the SHORT SL trails
Distances below are gold PRICE dollars, not pips/ticks or account risk.
Let **E = your actual short fill**. Immediately set regular broker protection:
- **Initial SL = E + $6.00.**
- **Fixed TP = E − $9.00.**
- **Trailing activation = E − $6.00.**
The TP remains at the original E−9 for the entire trade. Do not move TP when the SL moves.
At each completed 5-minute candle, if your trade is still open:
1. Honor the SL/TP already active during that candle. If either closed the trade, stop managing it.
2. Track **L = the lowest low since entry**, including the entry candle. Prefer consistent executable buy-back/ask prices for actual short management where available; midpoint chart data is only a reference. If you entered late within a candle, do not count a low reached before your fill as a post-entry favorable move.
3. While E−L is less than $6, leave SL unchanged.
4. Once E−L is at least $6, calculate **new SL = minimum(existing SL, L + $6)**.
5. Lower the stop AFTER the candle closes, so the new level protects the next candle. **Never raise or widen a short SL. Keep TP unchanged.**
The candle's LOW can activate the trail even if its close has bounced. Use the existing stop to judge that candle; do not retroactively apply the newly calculated stop to an earlier high in that same candle.
### Example: actual short fill 4300.00
| Surviving completed candle stage | Lowest low since fill | SL for next candle | Fixed TP |
|---|---:|---:|---:|
| Entry protection |4300.00|4306.00|4291.00|
| Not yet activated |4295.00|4306.00|4291.00|
| Activation wick reaches −6 |4294.00|4300.00|4291.00|
| Further favorable move |4292.00|4298.00|4291.00|
| Next candle has a higher low |4292.00 remains|4298.00 unchanged|4291.00|
If the executable buy-back price reaches TP 4291.00, the fixed target closes the short. If the active stop is reached first, it closes at that protection level subject to actual execution. Nominal entry-price breakeven does not guarantee net breakeven after fees/spread/slippage.
If the market has already bounced above a newly calculated short stop by the time you amend it, the broker may reject the amendment or require immediate exit. Do not raise/widen the stop to make the order acceptable; following this rule then requires closing at the next tradable price, which can differ from the model. Manual delays, gaps and variable spreads also change fills.
A broker's continuously moving native trailing stop is different: it may move intrabar. To follow the tested close-updated rule, use a regular SL and manually lower it on completed-candle updates.
## Chart and model limitations
Blue = source M5 EMA20. Optional purple = completed H1 EMA50. Red EXEC S triangle = confirmed decision. Cyan = newest next-bar model entry. Red SL line = stop active during that bar. Orange dots/labels = stop calculated at close for the following bar. Green = fixed TP. Yellow = trailing activation. Orange EXIT = model touch.
Live mode gates signals on one VIRTUAL position and 30-minute source cooldown. It cannot see whether you entered, skipped a signal, closed early or got stopped by a spread. A skipped signal still creates a model position; your broker position may diverge. Never assume a model-flat state means your broker is flat. In training capacity-5 mode each trade has separate levels/alerts, but the table and plots show the NEWEST trade only; alerts include model trade IDs.
OANDA charts on TradingView use midpoint prices, while broker execution uses bid/ask. Set broker SL/TP from YOUR fill and use actual executable prices. Never blindly copy a model reference to a differently filled trade. [Official price-basis explanation](tradingview.com/support/solutions/43000612408-why-was-my-order-executed-not-executed-although-the-price-on-the-chart-reached-or-didn-t-reach-the-order-level/).
No broker lot/quantity recommendation or account-risk sizing is generated by this indicator.
## Source results and verification — keep phase and capacity labels
- Original raw capacity-5 backtest: **72.60% WR, 53 wins / 73 trades**, January 2025–May 2026, normalized P/L $33,393.33, closed DD $2,880.83.
- A capacity-1 variant on the same training data: **73.13%, 49 / 67**, P/L $33,245.00. This is a different concurrency variant, not the 73-trade test.
- Supplied forward export: **55.56%, 15 / 27**, June–October 2026, P/L $6,677.50, closed DD $3,000. Source raw capacity 5 was safety-filtered to one position with zero recorded rejections. Generating with cap 1 remains an approximation to raw generation then post-filtering; rejected raw entries could affect later cooldown.
These are historical source results, not expected future win rates. Neither phase meets the source's 10-trades/month screening threshold; forward confidence is marked degrading. The user supplied a partial TradingView strategy report before this finalization; see the comparison below.
The underlying entry formulas matched the source engine on all 99,023 original M5 bars. A separate translation of the indicator's array/next-bar/old-stop-first management also reproduced all entry/exit times, entry prices, stops, targets and P/L: 73 capacity-5 trades and 67 capacity-1 trades. See Indicator verification.json. These checks do NOT execute or compile Pine or validate realtime notifications.
Next checks: compile the indicator, compare historical confirmed signals in the intended mode with enough chart history, then verify realtime PREPARE/EXECUTE/MOVE SL/MODEL EXIT delivery. Save exact error text if any. Indicator source management uses conservative stop-first candles; native Strategy Tester can choose TP first on a both-hit candle. Do not alter entry rules merely to force those fills to match.
## Recreate in another chat
Use the complete recreation comments AND implementation in VIBE QSFM-00220347 S v1.0 Trailing SL Indicator Pine.pine. Source M5/H1 initialization block is copied unchanged from this candidate's Strategy Pine. Important details: first-close EMA seeds; ATR mean-then-Wilder; inclusive rank; full 12-bar H1 buckets only; completed H1 available at decision OPEN; 241 source-bar readiness; fixed body0.55; no extra RSI/momentum filters; signal-open versus entry-open cooldown; next-bar model fill; old protection before new trail; short ratchet down; fixed TP; independent position arrays; provisional prepare latch; dynamic event routing; live no-expiry default versus historical date presets.
Source evidence QSFM-00220347-TradingView.md, source-payload-original.json, training/forward reference JSONs, Source verification.json and Strategy Pine preserve provenance and original engine behavior. verify_indicator_model.mjs / Indicator verification.json preserve current model checks. Root KNOWLEDGE.md and strategy-register.json preserve user workflow, status and paths. All generated/working files must stay
Naming: VIBE <QSFM-ID> <L/S> v<version> Trailing SL Indicator Pine; Strategy Pine has independent versioning. Current indicator is v1.0. Keep source historical rates separate from measured TradingView results. User requested creation, not automatic publishing or trading. This file uses consistent Windows CRLF line endings so Visual Studio should not show the inconsistent-line-endings prompt.
## Reviewed TradingView strategy result — October 19, 2026
Last 365 days: **43 closed trades, 30 wins / 13 losses, win rate 69.77%, net P/L 16,507.67 USD, profit factor 2.27, intrabar drawdown 3,331.53 USD**. This is a partial training sample, not the full 73-trade source sample or the Live capacity-1 result.
All 43 entry times/prices and exit times match the source; 42 exit prices match. The report window excludes 30 earlier source entries. On March 19, the newly lowered short stop 4708.655 was already through the market: TradingView filled at the next open 4709.265, while QSFM used the theoretical stop. Covered source P/L 16,610 minus the 101.666667 execution difference, scaled by TV quantity 166.66 / source 166.6666667, reconciles exactly to 16,507.67 after rounding. No entry-rule change was indicated. Full 73-trade TradingView comparison remains unverified; the user requested progressing to this indicator.
The indicator model translation already reproduced all 73 source training trades at capacity 5 and 67 at capacity 1. This verifies the translated model against source data, not Pine compilation or realtime alert delivery. Detailed evidence: Review 2026-10-19/Result review.md and Indicator verification.json. Historical results are not forecasts.
## What is ready
This is the SHORT EMA-rejection indicator for QSFM-00220347. It includes explanatory recreation comments, PREPARE, EXECUTE, MOVE SL and MODEL EXIT messages, historical confirmed markers, a filter/management table, configurable table location, display toggles and historical source-result notes.
User requested this indicator after reviewing the partial TradingView strategy result on October 19, 2026. The indicator still needs TradingView compilation and realtime alert checks. No broker orders or publication were performed.
## Install and choose the correct mode
1. Copy all text from **VIBE QSFM-00220347 S v1.0 Trailing SL Indicator Pine.pine** into a NEW indicator in TradingView Pine Editor. Save and add to **standard OANDA:XAUUSD, 5-minute candles**.
2. Choose **Live** for future signals. This is the default, has no signal end date and uses one virtual position at a time. Leave the live seed at June 3, 2026 for the initial comparison, and load sufficient history. Changing the seed changes initialization and potentially signals.
3. **Original backtest** mode is for historical checks: January 1, 2025 23:00 UTC to May 27, 2026 11:45 UTC, with original raw capacity 5. It allows up to five separate model positions and is not the Live capacity-1 workflow.
4. **Forward reference** mode is for the supplied June 3–October 16, 2026 historical comparison; its end is exclusive 09:10 UTC. It uses capacity 1 as an approximation to source safety filtering. This mode is expired for future signals; switch back to Live afterward.
5. This is an indicator, so its historical calculations use available chart bars. It does not inherit a Strategy Report's Deep Backtesting data range. Incomplete seed coverage is shown in the table; at least 241 source bars must load before signals qualify. Full original history is needed to compare original EMA/virtual-position paths accurately.
## Set up alerts
Create **ONE** TradingView alert with this indicator selected and **Any alert() function call** as the condition. Enable your chosen phone/app/sound notifications, choose expiration, then create it. All four event types are enabled by default and identified in their messages; use the indicator input toggles to select which events you want.
Do not create duplicate alerts for the same enabled event set. Alert frequency is handled by the script: PREPARE at most once per developing candle, other events at confirmed candle close. Different event types or different model trade IDs can legitimately occur on the same close, especially in historical capacity-5 mode.
Delete and recreate the alert after code, input, symbol or timeframe changes. TradingView saves a server copy of the alert's script and settings. Changing the chart does not update that copy. Alerts only fire on realtime bars; historical markers do not send past notifications. [Official alert documentation](tradingview.com/pine-script-docs/concepts/alerts/).
## What each message means
**PREPARE — provisional:** the current candle touches the developing EMA20, is bearish with body within 0.55 ATR, and its close is no higher than EMA20 + $0.50 (adjustable prepare tolerance), while other current filters, cooldown and model capacity pass. The candle is unfinished and may cancel. Do not enter just because PREPARE appears. This threshold is only an early notification, not a modification of the tested entry rule.
**EXECUTE — confirmed:** the finished candle satisfies ALL source rules, including close strictly below EMA20. Enter on the next available candle if taking the signal. PREPARE is not a prerequisite; EXECUTE can arrive without an earlier heads-up. The message estimates entry/SL/TP from the decision close; the actual next open and your broker fill may differ.
**MOVE SL — next bar:** a surviving completed candle lowers that model trade's stop. The message identifies its S-number and leaves TP fixed. The tool cannot amend your broker stop.
**MODEL EXIT:** the finished chart candle touched the model's existing stop or fixed target. It is not proof your broker closed the trade. Broker protection should execute when hit; do not wait for a candle-close message to respect it.
Signals use candle OPEN times 09:00–09:59 UTC on UTC weekdays. Their confirmed close/execute times are **09:05–10:00 UTC, or 16:05–17:00 Bangkok**. A 17:00 Bangkok execution can therefore be valid.
## TP is fixed; only the SHORT SL trails
Distances below are gold PRICE dollars, not pips/ticks or account risk.
Let **E = your actual short fill**. Immediately set regular broker protection:
- **Initial SL = E + $6.00.**
- **Fixed TP = E − $9.00.**
- **Trailing activation = E − $6.00.**
The TP remains at the original E−9 for the entire trade. Do not move TP when the SL moves.
At each completed 5-minute candle, if your trade is still open:
1. Honor the SL/TP already active during that candle. If either closed the trade, stop managing it.
2. Track **L = the lowest low since entry**, including the entry candle. Prefer consistent executable buy-back/ask prices for actual short management where available; midpoint chart data is only a reference. If you entered late within a candle, do not count a low reached before your fill as a post-entry favorable move.
3. While E−L is less than $6, leave SL unchanged.
4. Once E−L is at least $6, calculate **new SL = minimum(existing SL, L + $6)**.
5. Lower the stop AFTER the candle closes, so the new level protects the next candle. **Never raise or widen a short SL. Keep TP unchanged.**
The candle's LOW can activate the trail even if its close has bounced. Use the existing stop to judge that candle; do not retroactively apply the newly calculated stop to an earlier high in that same candle.
### Example: actual short fill 4300.00
| Surviving completed candle stage | Lowest low since fill | SL for next candle | Fixed TP |
|---|---:|---:|---:|
| Entry protection |4300.00|4306.00|4291.00|
| Not yet activated |4295.00|4306.00|4291.00|
| Activation wick reaches −6 |4294.00|4300.00|4291.00|
| Further favorable move |4292.00|4298.00|4291.00|
| Next candle has a higher low |4292.00 remains|4298.00 unchanged|4291.00|
If the executable buy-back price reaches TP 4291.00, the fixed target closes the short. If the active stop is reached first, it closes at that protection level subject to actual execution. Nominal entry-price breakeven does not guarantee net breakeven after fees/spread/slippage.
If the market has already bounced above a newly calculated short stop by the time you amend it, the broker may reject the amendment or require immediate exit. Do not raise/widen the stop to make the order acceptable; following this rule then requires closing at the next tradable price, which can differ from the model. Manual delays, gaps and variable spreads also change fills.
A broker's continuously moving native trailing stop is different: it may move intrabar. To follow the tested close-updated rule, use a regular SL and manually lower it on completed-candle updates.
## Chart and model limitations
Blue = source M5 EMA20. Optional purple = completed H1 EMA50. Red EXEC S triangle = confirmed decision. Cyan = newest next-bar model entry. Red SL line = stop active during that bar. Orange dots/labels = stop calculated at close for the following bar. Green = fixed TP. Yellow = trailing activation. Orange EXIT = model touch.
Live mode gates signals on one VIRTUAL position and 30-minute source cooldown. It cannot see whether you entered, skipped a signal, closed early or got stopped by a spread. A skipped signal still creates a model position; your broker position may diverge. Never assume a model-flat state means your broker is flat. In training capacity-5 mode each trade has separate levels/alerts, but the table and plots show the NEWEST trade only; alerts include model trade IDs.
OANDA charts on TradingView use midpoint prices, while broker execution uses bid/ask. Set broker SL/TP from YOUR fill and use actual executable prices. Never blindly copy a model reference to a differently filled trade. [Official price-basis explanation](tradingview.com/support/solutions/43000612408-why-was-my-order-executed-not-executed-although-the-price-on-the-chart-reached-or-didn-t-reach-the-order-level/).
No broker lot/quantity recommendation or account-risk sizing is generated by this indicator.
## Source results and verification — keep phase and capacity labels
- Original raw capacity-5 backtest: **72.60% WR, 53 wins / 73 trades**, January 2025–May 2026, normalized P/L $33,393.33, closed DD $2,880.83.
- A capacity-1 variant on the same training data: **73.13%, 49 / 67**, P/L $33,245.00. This is a different concurrency variant, not the 73-trade test.
- Supplied forward export: **55.56%, 15 / 27**, June–October 2026, P/L $6,677.50, closed DD $3,000. Source raw capacity 5 was safety-filtered to one position with zero recorded rejections. Generating with cap 1 remains an approximation to raw generation then post-filtering; rejected raw entries could affect later cooldown.
These are historical source results, not expected future win rates. Neither phase meets the source's 10-trades/month screening threshold; forward confidence is marked degrading. The user supplied a partial TradingView strategy report before this finalization; see the comparison below.
The underlying entry formulas matched the source engine on all 99,023 original M5 bars. A separate translation of the indicator's array/next-bar/old-stop-first management also reproduced all entry/exit times, entry prices, stops, targets and P/L: 73 capacity-5 trades and 67 capacity-1 trades. See Indicator verification.json. These checks do NOT execute or compile Pine or validate realtime notifications.
Next checks: compile the indicator, compare historical confirmed signals in the intended mode with enough chart history, then verify realtime PREPARE/EXECUTE/MOVE SL/MODEL EXIT delivery. Save exact error text if any. Indicator source management uses conservative stop-first candles; native Strategy Tester can choose TP first on a both-hit candle. Do not alter entry rules merely to force those fills to match.
## Recreate in another chat
Use the complete recreation comments AND implementation in VIBE QSFM-00220347 S v1.0 Trailing SL Indicator Pine.pine. Source M5/H1 initialization block is copied unchanged from this candidate's Strategy Pine. Important details: first-close EMA seeds; ATR mean-then-Wilder; inclusive rank; full 12-bar H1 buckets only; completed H1 available at decision OPEN; 241 source-bar readiness; fixed body0.55; no extra RSI/momentum filters; signal-open versus entry-open cooldown; next-bar model fill; old protection before new trail; short ratchet down; fixed TP; independent position arrays; provisional prepare latch; dynamic event routing; live no-expiry default versus historical date presets.
Source evidence QSFM-00220347-TradingView.md, source-payload-original.json, training/forward reference JSONs, Source verification.json and Strategy Pine preserve provenance and original engine behavior. verify_indicator_model.mjs / Indicator verification.json preserve current model checks. Root KNOWLEDGE.md and strategy-register.json preserve user workflow, status and paths. All generated/working files must stay
Naming: VIBE <QSFM-ID> <L/S> v<version> Trailing SL Indicator Pine; Strategy Pine has independent versioning. Current indicator is v1.0. Keep source historical rates separate from measured TradingView results. User requested creation, not automatic publishing or trading. This file uses consistent Windows CRLF line endings so Visual Studio should not show the inconsistent-line-endings prompt.
## Reviewed TradingView strategy result — October 19, 2026
Last 365 days: **43 closed trades, 30 wins / 13 losses, win rate 69.77%, net P/L 16,507.67 USD, profit factor 2.27, intrabar drawdown 3,331.53 USD**. This is a partial training sample, not the full 73-trade source sample or the Live capacity-1 result.
All 43 entry times/prices and exit times match the source; 42 exit prices match. The report window excludes 30 earlier source entries. On March 19, the newly lowered short stop 4708.655 was already through the market: TradingView filled at the next open 4709.265, while QSFM used the theoretical stop. Covered source P/L 16,610 minus the 101.666667 execution difference, scaled by TV quantity 166.66 / source 166.6666667, reconciles exactly to 16,507.67 after rounding. No entry-rule change was indicated. Full 73-trade TradingView comparison remains unverified; the user requested progressing to this indicator.
The indicator model translation already reproduced all 73 source training trades at capacity 5 and 67 at capacity 1. This verifies the translated model against source data, not Pine compilation or realtime alert delivery. Detailed evidence: Review 2026-10-19/Result review.md and Indicator verification.json. Historical results are not forecasts.

Declinazione di responsabilità
Le informazioni e le pubblicazioni non sono intese come, e non costituiscono, consulenza o raccomandazioni finanziarie, di investimento, di trading o di altro tipo fornite o approvate da TradingView. Per ulteriori informazioni, consultare i Termini di utilizzo.
Declinazione di responsabilità
Le informazioni e le pubblicazioni non sono intese come, e non costituiscono, consulenza o raccomandazioni finanziarie, di investimento, di trading o di altro tipo fornite o approvate da TradingView. Per ulteriori informazioni, consultare i Termini di utilizzo.