OPEN-SOURCE SCRIPT
Aggiornato Heikin Ashi Cloud Overlay | Rainbow Matrix
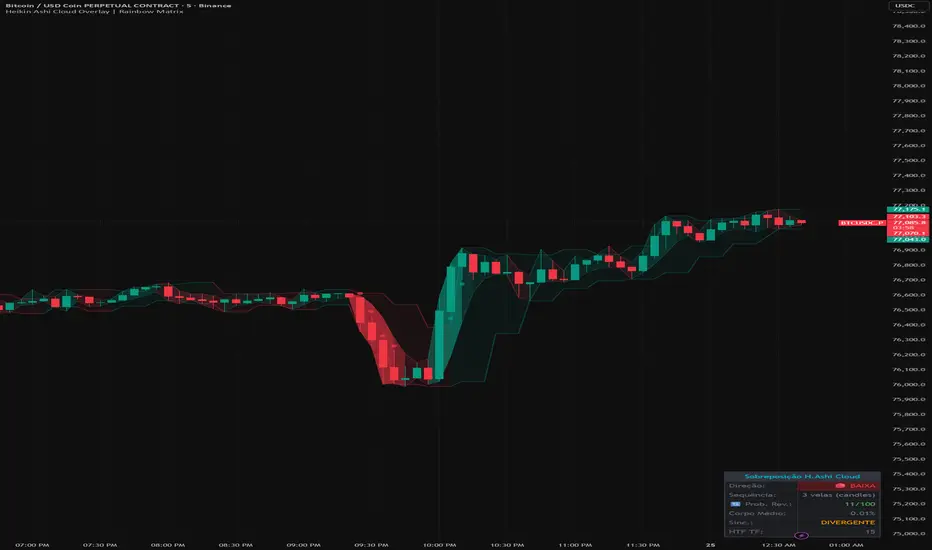
GENERAL OVERVIEW
The Heikin Ashi Cloud Overlay renders a Heikin Ashi cloud directly on top of traditional candlesticks, giving traders both views in a single chart. HA candles smooth macro trend perception by filtering individual-bar noise, but they sacrifice entry-bar precision because each HA candle does not represent the actual price range traded on that bar. This script preserves both signals simultaneously: the HA cloud surfaces directional context, while the underlying real candles preserve precise execution-bar timing.
A compact corner HUD reports current HA direction, consecutive streak length, and body-size anomalies relative to a 20-bar rolling average — useful for monitoring momentum exhaustion and impulsive expansion in real time without analyzing the cloud manually.
The script adds a visual intelligence layer on top of the standard HA pattern: cloud fill opacity dynamically reflects body intensity (impulsive bars render densely opaque, normal bars render lightly), and small colored dots flag body anomalies (current body > 3× rolling average) directly on the chart.

WHAT IS THE THEORY BEHIND THIS INDICATOR?
Heikin Ashi candles are derived from traditional OHLC via a recursive smoothing formula introduced by Munehisa Homma in 18th-century Japanese rice trading and popularized in modern Western technical analysis through the work of Dan Valcu and others. The transformation produces candles that emphasize trend persistence over discrete price action: consecutive same-color HA candles indicate ongoing directional pressure, while doji-like HA candles or sudden color flips often signal pivots.
The trade-off is well-known: HA candles do not show real OHLC. The haOpen of each candle is the average of the previous haOpen and haClose, not the actual session open. This makes HA excellent for trend reading but unreliable for entry timing — orders need to reference the actual price range of the bar, not the smoothed projection.
The conventional solutions are either to switch back and forth between HA and regular candle views (cognitive overhead), or to use HA as the primary chart and lose precision on entries (execution cost). This indicator takes a third approach: render the HA candles as a transparent overlay envelope on top of the standard candlesticks. The trader sees both at once. The HA envelope communicates trend context; the underlying candles preserve real-bar precision.
The state machine layered on top — direction tracking, streak counting, and body-size anomaly detection against a rolling average — converts the visual cloud into a numerical readout, surfacing exhaustion and impulsive moves that might be missed at a glance.
HA CLOUD OVERLAY FEATURES
The indicator includes 5 main components:
Heikin Ashi Cloud Overlay
Body Intensity Modulation (dynamic opacity)
Body Anomaly Visual Markers
HA State HUD Panel
Three Optional Alerts
HEIKIN ASHI CLOUD OVERLAY
🔹 What It Does
For each bar on the chart, the indicator computes the four Heikin Ashi values (haOpen, haClose, haHigh, haLow) using Pine Script's canonical recursive formula. It then renders a thin envelope between haHigh and haLow with semi-transparent fill, plotted on top of the underlying traditional candles.
🔹 Method
The computation follows the standard HA definition:
◇ haClose = (open + high + low + close) / 4
◇ haOpen = average of the previous haOpen and the previous haClose (recursive)
◇ haHigh = max of (high, haOpen, haClose)
◇ haLow = min of (low, haOpen, haClose)
A `var float ha_open = na` seed pattern handles the first-bar initialization safely, avoiding NA propagation that would corrupt the recursive chain.
🔹 Visual Behavior
The envelope is rendered as a thin top-bottom band with translucent fill. The fill color reflects the HA direction: bullish (haClose ≥ haOpen) renders in the configured bull color (TradingView native teal by default); bearish (haClose < haOpen) renders in the bear color (TradingView native red by default). An optional midline (dotted) at the (haOpen + haClose) / 2 level can be toggled for traders who prefer an explicit midpoint reference.
BODY INTENSITY MODULATION
🔹 What It Does
The cloud fill transparency is dynamically modulated based on the current HA body size relative to the 20-bar rolling average. Bars with above-average body push the fill toward more opaque, surfacing impulsive expansion clusters visually without requiring HUD analysis.
🔹 Tier Logic
◇ Body < 1× average: standard transparency (user-configured slider value)
◇ Body 1-2× average: −10 transparency (notable bar — slightly more opaque)
◇ Body 2-3× average: −30 transparency (strong bar — clearly more opaque)
◇ Body ≥ 3× average: −50 transparency, floor 20 (anomaly — densely opaque)
The floor cap of 20 prevents the fill from becoming so opaque that the underlying candle wicks become unreadable, preserving the dual-view principle of the indicator.
🔹 Why It Helps
Body intensity modulation converts the cloud from a static color band into a momentum-aware visualization. During quiet conditions, the cloud whispers; during impulsive expansion or capitulation phases, the cloud intensifies visually. Traders monitoring multiple charts can identify regime changes peripherally without focusing on any single chart's HUD.
🔹 Toggle
The feature is enabled by default and can be disabled via the "Body Intensity Cloud Opacity" input in the HA CLOUD group, which restores fixed transparency from the slider.
BODY ANOMALY VISUAL MARKERS
🔹 What It Does
A small colored dot appears on the chart whenever the current HA body exceeds 3× the 20-bar rolling average. Bull anomalies render as a dot below the bar (location.belowbar); bear anomalies render as a dot above the bar (location.abovebar). Dot colors match the configured bull/bear palette.
🔹 Why It Helps
The markers convert the alert-only body anomaly detection into a persistent visual signal that remains visible on chart history. Traders reviewing past price action can identify impulsive expansion or capitulation events at a glance, without scrolling through alert history or replaying bars.
🔹 Independent of the Alert
The visual markers and the body anomaly alert are independently toggleable. Traders can show the markers without enabling the alert (visual-only mode) or enable the alert without showing the markers (sound/notification-only mode).
🔹 Toggle
Enabled by default via the "Show Body Anomaly Markers" input in the HA CLOUD group.
HA STATE HUD PANEL
🔹 What It Shows
A compact 4-row corner panel reports three live values:
◇ Direction — current HA candle direction (Bull / Bear), color-coded
◇ Streak — consecutive same-direction count (in current locale, e.g., "7 velas (candles)" in PT)
◇ Avg Body — the average HA body size over the last 20 bars, expressed as a percentage of price
🔹 Why It Helps
The HUD converts the cloud into a numerical readout. Instead of visually estimating streak length or body proportion, traders can read the exact values on each bar. This is particularly useful for traders monitoring multiple charts or running automated rules where consecutive-bar conditions need to be tracked precisely.
🔹 Customization
The HUD can be positioned in any of the four chart corners and rendered in any of five font sizes. The Direction row uses contrasting colors (bull vs bear) for immediate parsing.
THREE OPTIONAL ALERTS
🔹 Alert Types
Each alert is independently toggleable in the indicator settings:
◇ HA Direction Change — fires on the close of a confirmed bar when the HA direction flips (bull→bear or bear→bull). Useful as a confirmation filter on top of other entry signals.
◇ HA Streak Exhaustion — fires when the absolute streak length crosses a user-configurable threshold (default 7). Long consecutive streaks often precede mean-reversion phases, especially in ranging markets.
◇ HA Body Anomaly — fires when the current HA body exceeds 3× the 20-bar rolling average. Anomalous body sizes typically signal impulsive expansion, capitulation, or news-driven moves worth investigating.
🔹 Firing Mechanism
All alerts are gated by `barstate.isconfirmed`, which means they only trigger on the close of the bar that satisfies the condition — never intra-bar. This prevents false signals from intrabar fluctuations that get rejected before close. Each alert uses `alert.freq_once_per_bar` to avoid duplicate firings on the same candle.
🔹 alertcondition() Mode
A dummy `alertcondition` titled "HOW TO SETUP ALERTS (READ)" is exposed at the bottom of the script. It provides setup guidance via its message field, instructing users to select "Any alert() function call" in the TradingView alert condition menu and filter individual alerts via the indicator settings.
MULTILINGUAL INTERFACE
The indicator supports five languages for the HUD display and alert messages: English (default), Português, Español, Русский, and 中文 (Chinese). Code, comments, and configuration tooltips remain in English regardless of the selected language.
For reference, examples of multilingual UI strings used in the HUD:
◇ Direction labels: "Direction:" / "Direção:" / "Dirección:" / "Направление:" / "方向:"
◇ Direction text: "🟢 BULL"/"🔴 BEAR" / "🟢 ALTA"/"🔴 BAIXA" / "🟢 ALCISTA"/"🔴 BAJISTA" / "🟢 БЫЧИЙ"/"🔴 МЕДВЕЖИЙ" / "🟢 多头"/"🔴 空头"
◇ Streak units use a bilingual pattern: "candles" stays in English as a universal technical term; native terms appear in parentheses where the local equivalent is well-established (e.g., "7 velas (candles)").
CUSTOM PALETTE TOGGLE
🔹 What It Does
By default, the indicator uses native TradingView teal/red colors for visual familiarity. A "Use Custom Cloud Colors" toggle in the settings switches to user-configurable bull/bear colors, useful for traders who want to align the cloud palette with their personal indicator stack or color preferences.
HOW TO USE
This indicator is a visualization tool, not a signal generator. It surfaces three categories of structural information: HA direction (smoothed trend context), streak length (momentum persistence), and body anomalies (impulsive moves).
🔹 Reading the Cloud
◇ Bull cloud (default teal) = current HA candle is bullish (haClose ≥ haOpen).
◇ Bear cloud (default red) = current HA candle is bearish (haClose < haOpen).
◇ A long sequence of same-color HA candles indicates strong directional pressure; mixed colors or doji-like HA candles indicate consolidation or pivot zones.
◇ Cloud density (opacity): denser fills mark bars with above-average body — pay attention to these zones, they often correspond to ignition or capitulation phases.
◇ Anomaly dots: when a dot appears below a bull bar or above a bear bar, the bar's body is 3× the recent average — exceptional impulse worth contextualizing against your other signals.
🔹 Reading the HUD
◇ Direction row: parse the current HA candle's directional state at a glance.
◇ Streak row: |streak| ≥ 7 → trend is mature, increasing probability of mean reversion or pullback. Streak just flipped sign → fresh direction.
◇ Avg Body row: current bar body > 3× this value → impulsive expansion or capitulation, worth investigating contextually.
🔹 Tactical Reading
◇ HA color flip + confirmation on the underlying candle: potential trend reversal or pullback entry.
◇ HA streak crosses the exhaustion threshold while price approaches a key level (from another indicator or manual S/R): increased probability of structural reaction.
◇ Body anomaly during otherwise quiet conditions: impulsive move (often news-driven or stop-cascade) — trade with reduced size or wait for retest.
◇ Cluster of dense-opacity bars: regime change or ongoing impulsive move — momentum is structurally elevated.
🔹 Multi-Indicator Workflow
The HA Cloud Overlay is designed to layer cleanly with other indicators. It does not add lines or boxes that compete visually with structural indicators (VWAP, Volume Profile, S/R). The cloud sits behind the candles, the markers are minimal dots, and the HUD sits in a corner — total chart footprint is minimal.
INPUTS EXPLAINED
🔹 System Language
Display language for the HUD and alert messages. Options: English (default), Português, Español, Русский, 中文.
🔹 Show Cloud Envelope
Master toggle for the HA top-bottom envelope and fill.
🔹 Cloud Fill Transparency
Base alpha of the cloud fill (60 = denser, 95 = barely visible). Floor of 60 keeps candle wicks readable. Default 80. When Body Intensity Modulation is ON, this value is the baseline; bars with above-average body intensity become progressively more opaque from this baseline.
🔹 Show HA Midline (dots)
Optional thin dotted line at (haOpen + haClose) / 2.
🔹 Use Custom Cloud Colors
OFF: native TradingView teal/red. ON: apply custom bull/bear colors below.
🔹 Custom Bull Color / Custom Bear Color
Used when "Use Custom Cloud Colors" is ON.
🔹 Body Intensity Cloud Opacity
When ON: cloud fill becomes progressively more opaque on bars with above-average body size. When OFF: cloud uses fixed transparency from the slider above. Recommended ON.
🔹 Show Body Anomaly Markers
When ON: small colored dots appear on bars whose body exceeds 3× the 20-period average. Independent of the body anomaly alert.
🔹 Show HA State HUD
Toggle for the corner HUD reporting Direction / Streak / Avg Body.
🔹 HUD Position
Top Right (default), Top Left, Bottom Right, Bottom Left.
🔹 Font Size
Tiny, Small (default), Normal, Large, Huge.
🔹 Streak Warning Threshold
Streak length at which the Streak Exhaustion alert fires. Range 3–30, default 7.
🔹 Alert: HA Direction Change / HA Streak Extreme / HA Body Anomaly
Independent toggles for each of the three alert types.
IMPORTANT NOTES
The Heikin Ashi Cloud Overlay works on any timeframe and any instrument. The HA computation is timeframe-agnostic — it transforms whatever OHLC data the chart provides.
Alerts fire once per confirmed bar. Historical bars never repaint after they close. The live bar updates intra-bar as expected for a real-time indicator, but alerts will only fire after the bar closes. Body anomaly visual markers can update intra-bar (preview behavior) and settle on close.
The body anomaly threshold (3× rolling average) and streak warning threshold (default 7) are derived from empirical observation across common timeframes and instruments. Both are user-configurable and should be tuned to the trader's instrument and timeframe — high-volatility crypto on 1m may warrant a higher anomaly multiplier than large-cap equities on Daily.
The 20-bar body rolling average uses `ta.sma` of the percentage-based body size. The first 20 bars after script start will show partial values; once enough history is available, the value stabilizes.
The body intensity modulation tier floors (50, 30, 20) are calibrated to preserve candle wick readability even on extreme anomaly bars — the floor 20 ensures the cloud never becomes fully opaque.
Pine Script v6. Open-source under Mozilla Public License 2.0.
UNIQUENESS
The Heikin Ashi Cloud Overlay differs from the standard TradingView Heikin Ashi chart type and from other HA-based indicators in four structural ways.
First, it preserves both views simultaneously rather than replacing one with the other. Standard HA chart mode hides the real candles entirely; this overlay keeps the underlying candles visible at all times, giving traders smoothed trend context (the cloud) and precise entry-bar timing (the underlying candles) in the same visual without context-switching cost.
Second, the cloud fill opacity is dynamically modulated by body intensity relative to a 20-bar rolling average. Standard HA cloud indicators render fills with a single static transparency; this script renders impulsive bars (≥1×, ≥2×, ≥3× average body) with progressively more opaque fills, transforming the cloud from a static visualization into a momentum-aware density map. Capitulation, ignition, and impulsive expansion phases become visually identifiable peripheral signals.
Third, it adds an explicit state machine layer over the raw HA visualization. Direction tracking, consecutive streak counting, 20-bar rolling body-size anomaly detection, and on-chart visual anomaly markers convert the visual cloud into a numerical readout reported live on a corner HUD. This converts subjective visual estimation (is this a long streak? is this body unusually large?) into deterministic measurements with configurable thresholds and a persistent visual record on the chart history.
Fourth, it exposes three independently-toggleable alerts (direction change, streak exhaustion, body anomaly) gated by bar confirmation, making the indicator usable as a confirmation filter or trigger source in automated workflows. Most HA-based indicators are visualization-only or expose a single direction-flip alert; the multi-condition alert set here is designed for traders building structured rules around HA state rather than just observing it.
The combination of dual-view preservation, body-intensity opacity modulation, state machine readout, visual anomaly markers, and multilingual UI produces a single overlay that combines the readability of Heikin Ashi smoothing with the precision of real candles, the rigor of a deterministic state readout, and the visual intuition of a density-aware momentum map.
The Heikin Ashi Cloud Overlay renders a Heikin Ashi cloud directly on top of traditional candlesticks, giving traders both views in a single chart. HA candles smooth macro trend perception by filtering individual-bar noise, but they sacrifice entry-bar precision because each HA candle does not represent the actual price range traded on that bar. This script preserves both signals simultaneously: the HA cloud surfaces directional context, while the underlying real candles preserve precise execution-bar timing.
A compact corner HUD reports current HA direction, consecutive streak length, and body-size anomalies relative to a 20-bar rolling average — useful for monitoring momentum exhaustion and impulsive expansion in real time without analyzing the cloud manually.
The script adds a visual intelligence layer on top of the standard HA pattern: cloud fill opacity dynamically reflects body intensity (impulsive bars render densely opaque, normal bars render lightly), and small colored dots flag body anomalies (current body > 3× rolling average) directly on the chart.
WHAT IS THE THEORY BEHIND THIS INDICATOR?
Heikin Ashi candles are derived from traditional OHLC via a recursive smoothing formula introduced by Munehisa Homma in 18th-century Japanese rice trading and popularized in modern Western technical analysis through the work of Dan Valcu and others. The transformation produces candles that emphasize trend persistence over discrete price action: consecutive same-color HA candles indicate ongoing directional pressure, while doji-like HA candles or sudden color flips often signal pivots.
The trade-off is well-known: HA candles do not show real OHLC. The haOpen of each candle is the average of the previous haOpen and haClose, not the actual session open. This makes HA excellent for trend reading but unreliable for entry timing — orders need to reference the actual price range of the bar, not the smoothed projection.
The conventional solutions are either to switch back and forth between HA and regular candle views (cognitive overhead), or to use HA as the primary chart and lose precision on entries (execution cost). This indicator takes a third approach: render the HA candles as a transparent overlay envelope on top of the standard candlesticks. The trader sees both at once. The HA envelope communicates trend context; the underlying candles preserve real-bar precision.
The state machine layered on top — direction tracking, streak counting, and body-size anomaly detection against a rolling average — converts the visual cloud into a numerical readout, surfacing exhaustion and impulsive moves that might be missed at a glance.
HA CLOUD OVERLAY FEATURES
The indicator includes 5 main components:
Heikin Ashi Cloud Overlay
Body Intensity Modulation (dynamic opacity)
Body Anomaly Visual Markers
HA State HUD Panel
Three Optional Alerts
HEIKIN ASHI CLOUD OVERLAY
🔹 What It Does
For each bar on the chart, the indicator computes the four Heikin Ashi values (haOpen, haClose, haHigh, haLow) using Pine Script's canonical recursive formula. It then renders a thin envelope between haHigh and haLow with semi-transparent fill, plotted on top of the underlying traditional candles.
🔹 Method
The computation follows the standard HA definition:
◇ haClose = (open + high + low + close) / 4
◇ haOpen = average of the previous haOpen and the previous haClose (recursive)
◇ haHigh = max of (high, haOpen, haClose)
◇ haLow = min of (low, haOpen, haClose)
A `var float ha_open = na` seed pattern handles the first-bar initialization safely, avoiding NA propagation that would corrupt the recursive chain.
🔹 Visual Behavior
The envelope is rendered as a thin top-bottom band with translucent fill. The fill color reflects the HA direction: bullish (haClose ≥ haOpen) renders in the configured bull color (TradingView native teal by default); bearish (haClose < haOpen) renders in the bear color (TradingView native red by default). An optional midline (dotted) at the (haOpen + haClose) / 2 level can be toggled for traders who prefer an explicit midpoint reference.
BODY INTENSITY MODULATION
🔹 What It Does
The cloud fill transparency is dynamically modulated based on the current HA body size relative to the 20-bar rolling average. Bars with above-average body push the fill toward more opaque, surfacing impulsive expansion clusters visually without requiring HUD analysis.
🔹 Tier Logic
◇ Body < 1× average: standard transparency (user-configured slider value)
◇ Body 1-2× average: −10 transparency (notable bar — slightly more opaque)
◇ Body 2-3× average: −30 transparency (strong bar — clearly more opaque)
◇ Body ≥ 3× average: −50 transparency, floor 20 (anomaly — densely opaque)
The floor cap of 20 prevents the fill from becoming so opaque that the underlying candle wicks become unreadable, preserving the dual-view principle of the indicator.
🔹 Why It Helps
Body intensity modulation converts the cloud from a static color band into a momentum-aware visualization. During quiet conditions, the cloud whispers; during impulsive expansion or capitulation phases, the cloud intensifies visually. Traders monitoring multiple charts can identify regime changes peripherally without focusing on any single chart's HUD.
🔹 Toggle
The feature is enabled by default and can be disabled via the "Body Intensity Cloud Opacity" input in the HA CLOUD group, which restores fixed transparency from the slider.
BODY ANOMALY VISUAL MARKERS
🔹 What It Does
A small colored dot appears on the chart whenever the current HA body exceeds 3× the 20-bar rolling average. Bull anomalies render as a dot below the bar (location.belowbar); bear anomalies render as a dot above the bar (location.abovebar). Dot colors match the configured bull/bear palette.
🔹 Why It Helps
The markers convert the alert-only body anomaly detection into a persistent visual signal that remains visible on chart history. Traders reviewing past price action can identify impulsive expansion or capitulation events at a glance, without scrolling through alert history or replaying bars.
🔹 Independent of the Alert
The visual markers and the body anomaly alert are independently toggleable. Traders can show the markers without enabling the alert (visual-only mode) or enable the alert without showing the markers (sound/notification-only mode).
🔹 Toggle
Enabled by default via the "Show Body Anomaly Markers" input in the HA CLOUD group.
HA STATE HUD PANEL
🔹 What It Shows
A compact 4-row corner panel reports three live values:
◇ Direction — current HA candle direction (Bull / Bear), color-coded
◇ Streak — consecutive same-direction count (in current locale, e.g., "7 velas (candles)" in PT)
◇ Avg Body — the average HA body size over the last 20 bars, expressed as a percentage of price
🔹 Why It Helps
The HUD converts the cloud into a numerical readout. Instead of visually estimating streak length or body proportion, traders can read the exact values on each bar. This is particularly useful for traders monitoring multiple charts or running automated rules where consecutive-bar conditions need to be tracked precisely.
🔹 Customization
The HUD can be positioned in any of the four chart corners and rendered in any of five font sizes. The Direction row uses contrasting colors (bull vs bear) for immediate parsing.
THREE OPTIONAL ALERTS
🔹 Alert Types
Each alert is independently toggleable in the indicator settings:
◇ HA Direction Change — fires on the close of a confirmed bar when the HA direction flips (bull→bear or bear→bull). Useful as a confirmation filter on top of other entry signals.
◇ HA Streak Exhaustion — fires when the absolute streak length crosses a user-configurable threshold (default 7). Long consecutive streaks often precede mean-reversion phases, especially in ranging markets.
◇ HA Body Anomaly — fires when the current HA body exceeds 3× the 20-bar rolling average. Anomalous body sizes typically signal impulsive expansion, capitulation, or news-driven moves worth investigating.
🔹 Firing Mechanism
All alerts are gated by `barstate.isconfirmed`, which means they only trigger on the close of the bar that satisfies the condition — never intra-bar. This prevents false signals from intrabar fluctuations that get rejected before close. Each alert uses `alert.freq_once_per_bar` to avoid duplicate firings on the same candle.
🔹 alertcondition() Mode
A dummy `alertcondition` titled "HOW TO SETUP ALERTS (READ)" is exposed at the bottom of the script. It provides setup guidance via its message field, instructing users to select "Any alert() function call" in the TradingView alert condition menu and filter individual alerts via the indicator settings.
MULTILINGUAL INTERFACE
The indicator supports five languages for the HUD display and alert messages: English (default), Português, Español, Русский, and 中文 (Chinese). Code, comments, and configuration tooltips remain in English regardless of the selected language.
For reference, examples of multilingual UI strings used in the HUD:
◇ Direction labels: "Direction:" / "Direção:" / "Dirección:" / "Направление:" / "方向:"
◇ Direction text: "🟢 BULL"/"🔴 BEAR" / "🟢 ALTA"/"🔴 BAIXA" / "🟢 ALCISTA"/"🔴 BAJISTA" / "🟢 БЫЧИЙ"/"🔴 МЕДВЕЖИЙ" / "🟢 多头"/"🔴 空头"
◇ Streak units use a bilingual pattern: "candles" stays in English as a universal technical term; native terms appear in parentheses where the local equivalent is well-established (e.g., "7 velas (candles)").
CUSTOM PALETTE TOGGLE
🔹 What It Does
By default, the indicator uses native TradingView teal/red colors for visual familiarity. A "Use Custom Cloud Colors" toggle in the settings switches to user-configurable bull/bear colors, useful for traders who want to align the cloud palette with their personal indicator stack or color preferences.
HOW TO USE
This indicator is a visualization tool, not a signal generator. It surfaces three categories of structural information: HA direction (smoothed trend context), streak length (momentum persistence), and body anomalies (impulsive moves).
🔹 Reading the Cloud
◇ Bull cloud (default teal) = current HA candle is bullish (haClose ≥ haOpen).
◇ Bear cloud (default red) = current HA candle is bearish (haClose < haOpen).
◇ A long sequence of same-color HA candles indicates strong directional pressure; mixed colors or doji-like HA candles indicate consolidation or pivot zones.
◇ Cloud density (opacity): denser fills mark bars with above-average body — pay attention to these zones, they often correspond to ignition or capitulation phases.
◇ Anomaly dots: when a dot appears below a bull bar or above a bear bar, the bar's body is 3× the recent average — exceptional impulse worth contextualizing against your other signals.
🔹 Reading the HUD
◇ Direction row: parse the current HA candle's directional state at a glance.
◇ Streak row: |streak| ≥ 7 → trend is mature, increasing probability of mean reversion or pullback. Streak just flipped sign → fresh direction.
◇ Avg Body row: current bar body > 3× this value → impulsive expansion or capitulation, worth investigating contextually.
🔹 Tactical Reading
◇ HA color flip + confirmation on the underlying candle: potential trend reversal or pullback entry.
◇ HA streak crosses the exhaustion threshold while price approaches a key level (from another indicator or manual S/R): increased probability of structural reaction.
◇ Body anomaly during otherwise quiet conditions: impulsive move (often news-driven or stop-cascade) — trade with reduced size or wait for retest.
◇ Cluster of dense-opacity bars: regime change or ongoing impulsive move — momentum is structurally elevated.
🔹 Multi-Indicator Workflow
The HA Cloud Overlay is designed to layer cleanly with other indicators. It does not add lines or boxes that compete visually with structural indicators (VWAP, Volume Profile, S/R). The cloud sits behind the candles, the markers are minimal dots, and the HUD sits in a corner — total chart footprint is minimal.
INPUTS EXPLAINED
🔹 System Language
Display language for the HUD and alert messages. Options: English (default), Português, Español, Русский, 中文.
🔹 Show Cloud Envelope
Master toggle for the HA top-bottom envelope and fill.
🔹 Cloud Fill Transparency
Base alpha of the cloud fill (60 = denser, 95 = barely visible). Floor of 60 keeps candle wicks readable. Default 80. When Body Intensity Modulation is ON, this value is the baseline; bars with above-average body intensity become progressively more opaque from this baseline.
🔹 Show HA Midline (dots)
Optional thin dotted line at (haOpen + haClose) / 2.
🔹 Use Custom Cloud Colors
OFF: native TradingView teal/red. ON: apply custom bull/bear colors below.
🔹 Custom Bull Color / Custom Bear Color
Used when "Use Custom Cloud Colors" is ON.
🔹 Body Intensity Cloud Opacity
When ON: cloud fill becomes progressively more opaque on bars with above-average body size. When OFF: cloud uses fixed transparency from the slider above. Recommended ON.
🔹 Show Body Anomaly Markers
When ON: small colored dots appear on bars whose body exceeds 3× the 20-period average. Independent of the body anomaly alert.
🔹 Show HA State HUD
Toggle for the corner HUD reporting Direction / Streak / Avg Body.
🔹 HUD Position
Top Right (default), Top Left, Bottom Right, Bottom Left.
🔹 Font Size
Tiny, Small (default), Normal, Large, Huge.
🔹 Streak Warning Threshold
Streak length at which the Streak Exhaustion alert fires. Range 3–30, default 7.
🔹 Alert: HA Direction Change / HA Streak Extreme / HA Body Anomaly
Independent toggles for each of the three alert types.
IMPORTANT NOTES
The Heikin Ashi Cloud Overlay works on any timeframe and any instrument. The HA computation is timeframe-agnostic — it transforms whatever OHLC data the chart provides.
Alerts fire once per confirmed bar. Historical bars never repaint after they close. The live bar updates intra-bar as expected for a real-time indicator, but alerts will only fire after the bar closes. Body anomaly visual markers can update intra-bar (preview behavior) and settle on close.
The body anomaly threshold (3× rolling average) and streak warning threshold (default 7) are derived from empirical observation across common timeframes and instruments. Both are user-configurable and should be tuned to the trader's instrument and timeframe — high-volatility crypto on 1m may warrant a higher anomaly multiplier than large-cap equities on Daily.
The 20-bar body rolling average uses `ta.sma` of the percentage-based body size. The first 20 bars after script start will show partial values; once enough history is available, the value stabilizes.
The body intensity modulation tier floors (50, 30, 20) are calibrated to preserve candle wick readability even on extreme anomaly bars — the floor 20 ensures the cloud never becomes fully opaque.
Pine Script v6. Open-source under Mozilla Public License 2.0.
UNIQUENESS
The Heikin Ashi Cloud Overlay differs from the standard TradingView Heikin Ashi chart type and from other HA-based indicators in four structural ways.
First, it preserves both views simultaneously rather than replacing one with the other. Standard HA chart mode hides the real candles entirely; this overlay keeps the underlying candles visible at all times, giving traders smoothed trend context (the cloud) and precise entry-bar timing (the underlying candles) in the same visual without context-switching cost.
Second, the cloud fill opacity is dynamically modulated by body intensity relative to a 20-bar rolling average. Standard HA cloud indicators render fills with a single static transparency; this script renders impulsive bars (≥1×, ≥2×, ≥3× average body) with progressively more opaque fills, transforming the cloud from a static visualization into a momentum-aware density map. Capitulation, ignition, and impulsive expansion phases become visually identifiable peripheral signals.
Third, it adds an explicit state machine layer over the raw HA visualization. Direction tracking, consecutive streak counting, 20-bar rolling body-size anomaly detection, and on-chart visual anomaly markers convert the visual cloud into a numerical readout reported live on a corner HUD. This converts subjective visual estimation (is this a long streak? is this body unusually large?) into deterministic measurements with configurable thresholds and a persistent visual record on the chart history.
Fourth, it exposes three independently-toggleable alerts (direction change, streak exhaustion, body anomaly) gated by bar confirmation, making the indicator usable as a confirmation filter or trigger source in automated workflows. Most HA-based indicators are visualization-only or expose a single direction-flip alert; the multi-condition alert set here is designed for traders building structured rules around HA state rather than just observing it.
The combination of dual-view preservation, body-intensity opacity modulation, state machine readout, visual anomaly markers, and multilingual UI produces a single overlay that combines the readability of Heikin Ashi smoothing with the precision of real candles, the rigor of a deterministic state readout, and the visual intuition of a density-aware momentum map.
Note di rilascio
This is a substantive update adding three new analytical capabilities and several UX refinements, while keeping every v1.4 behavior intact and 100% bit-exact compatible.NEW — HTF HEIKIN ASHI CLOUD OVERLAY
A ghosted Heikin Ashi cloud from a higher timeframe (default Daily) overlays the local cloud. When HTF and local share direction, the ghost cloud reinforces the trend; when they diverge, it's a quiet warning about counter-trend setups. Anti-repaint — HTF values lock only when the HTF bar closes. Default transparency tuned to 95 so the HTF never overwhelms the local cloud — visual hierarchy preserved.
Inputs:
Show HTF H.Ashi Cloud (toggle, OFF by default)
Higher Timeframe (default D, configurable)
HTF Cloud Line Width
HTF Cloud Fill Transparency (default 95 — "ghost cloud")
NEW — REVERSAL PROBABILITY SCORE (0-100)
A composite signal in the HUD estimating the probability of a near-term reversal of the current HA trend. Computed from three weighted components:
40% — Streak length (longer streaks = closer to exhaustion)
35% — Body intensity (current body vs 20-bar average)
25% — Anomaly rate (frequency of 3× body anomalies in last 20 bars)
Score interpretation — higher means MORE reversal probability:
0–30 (green): trend is strong, low reversal probability
30–70 (gray): neutral / transition zone
70–100 (red, with ⚠️ marker): exhaustion signals high, reversal probable
A dedicated edge-triggered alert (Score ≥ 80) fires once on threshold crossing — does NOT spam while score stays above 80. OFF by default to avoid overlap with the Streak Exhaustion alert; enable selectively.
NEW — MTF SYNCHRONY ROW
A new HUD row reports the relationship between the local H.Ashi direction and the HTF H.Ashi direction in real time:
ALIGNED (green): local + HTF agree (both bull or both bear) — with-trend
DIVERGENT (orange): local and HTF disagree — counter-trend setup, pivot zone, or early regime change
N/A (gray): HTF data warming up (first bars after refresh)
HTF off (gray): HTF cloud is disabled — sync analysis not applicable
A separate HTF TF disclosure row shows exactly which timeframe is being read. Together they answer at a glance: "what is the alignment, and against which TF?"
HUD ENHANCEMENTS
The H.Ashi State HUD now reports 6 rows of context (was 3 in v1.4):
Direction (▲ BULL / ▼ BEAR — colored)
Streak (signed count)
🔄 Rev. Prob. (XX/100, color-tiered; ⚠️ marker at red tier)
Avg Body % (20-bar smoothed)
Sync (ALIGNED / DIVERGENT / N/A / HTF off, colored)
HTF TF (D, 240, 60, etc. — discloses HTF context)
Local Cloud transparency default tuned to 90 (more "ghosted") for cleaner price-action read. All UI text — including new rows and alert messages — translated across EN/PT/ES/RU/ZH.
READABILITY POLISH
Terminology: "HA" abbreviation replaced with "H.Ashi" throughout the user interface — input labels, HUD title, plot legend, alert messages, and tooltips. Easier to read for users newer to Heikin Ashi.
HUD score label now reads "🔄 Rev. Prob." instead of compact "Score:" — makes clear that the value measures REVERSAL probability, with directional emphasis (higher = more probable).
Cleaned decorative emojis from settings panel group names — interface now reads cleanly without symbol noise. UX-functional indicators (HUD direction 🟢🔴, alert message prefixes 🌊⚠️💥📊, and the new 🔄 Rev. Prob. cue) intentionally preserved.
Chinese typography refinement — all HUD label colons normalized to fullwidth :.
Indicator declaration cleanup (removed unused parameters).
ALERTS — FULL LIST
H.Ashi Direction Change — fires on every bull/bear flip (close-confirmed)
H.Ashi Streak Exhaustion — fires when streak crosses the warning threshold (configurable)
H.Ashi Body Anomaly — fires on a body 3× the 20-bar average (potential climax)
H.Ashi Reversal Probability ≥ 80 — fires once on score crossing 80 from below (NEW)
PRESERVED — 100% BIT-EXACT COMPATIBLE WITH v1.4
Existing users with custom saved settings see ZERO behavioral change to the local H.Ashi cloud, body anomaly markers, body intensity modulation, palette, state machine, streak counter, all v1.4 alerts, billboard alertcondition, and custom color override. The new features are additive — toggle-controlled and OFF/ON defaults chosen to avoid surprises.
LANGUAGE
Set "System Language" in the indicator settings to EN / PT / ES / RU / ZH for native HUD and alert text.
THANKS to the community for the feedback that drove these features — keep it coming. — Rainbow Matrix
Script open-source
Nello spirito di TradingView, l'autore di questo script lo ha reso open source, in modo che i trader possano esaminarne e verificarne la funzionalità. Complimenti all'autore! Sebbene sia possibile utilizzarlo gratuitamente, ricordiamo che la ripubblicazione del codice è soggetta al nostro Regolamento.

Rainbow Matrix AI - Multi-timeframe institutional analysis tools.
rainbowmatrix.ai
rainbowmatrix.ai
Declinazione di responsabilità
Le informazioni e le pubblicazioni non sono intese come, e non costituiscono, consulenza o raccomandazioni finanziarie, di investimento, di trading o di altro tipo fornite o approvate da TradingView. Per ulteriori informazioni, consultare i Termini di utilizzo.
Script open-source
Nello spirito di TradingView, l'autore di questo script lo ha reso open source, in modo che i trader possano esaminarne e verificarne la funzionalità. Complimenti all'autore! Sebbene sia possibile utilizzarlo gratuitamente, ricordiamo che la ripubblicazione del codice è soggetta al nostro Regolamento.
Rainbow Matrix AI - Multi-timeframe institutional analysis tools.
rainbowmatrix.ai
rainbowmatrix.ai
Declinazione di responsabilità
Le informazioni e le pubblicazioni non sono intese come, e non costituiscono, consulenza o raccomandazioni finanziarie, di investimento, di trading o di altro tipo fornite o approvate da TradingView. Per ulteriori informazioni, consultare i Termini di utilizzo.