OPEN-SOURCE SCRIPT
Aggiornato Darvas Box Breakout Quality [AGPro Series]
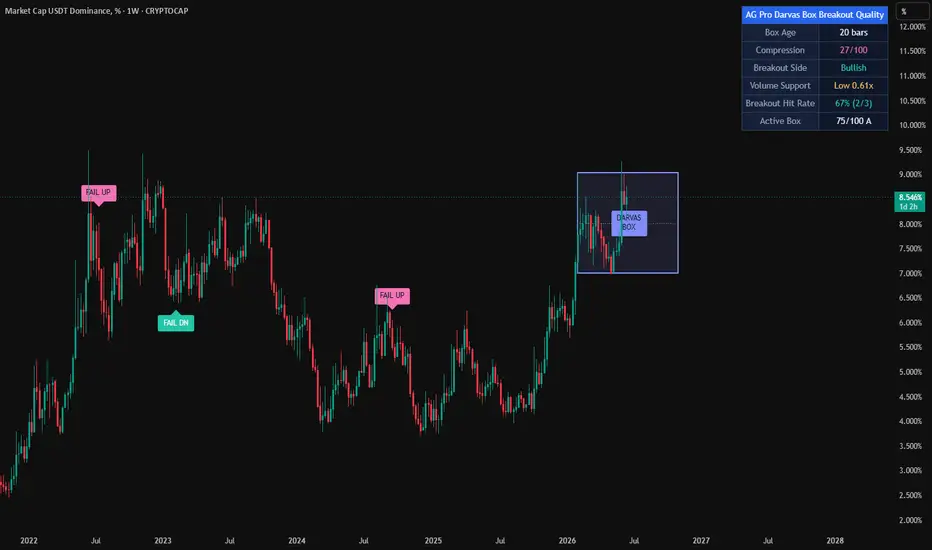
Darvas Box Breakout Quality [AGPro Series]
🔹 OVERVIEW
Darvas Box Breakout Quality [AGPro Series] is built for one of the most recognizable and widely searched chart-pattern structures in technical analysis: the Darvas Box.
The script focuses on the full Darvas lifecycle:
Box formation → compression quality → breakout direction → volume support → failed-break behavior.
Instead of treating every horizontal range as support and resistance, this script waits for a Darvas-style structure to form, validates the box by age and volatility-adjusted height, then evaluates how price resolves from that box. The result is a clean chart-pattern workflow designed for traders who want to study rectangular compression and breakout quality without turning the chart into a crowded zone map.
The main visual element is the active Darvas box itself. By default, resolved boxes are removed after breakout so the chart stays focused on the current live structure instead of filling with old rectangles.
🔹 WHAT MAKES IT DIFFERENT
Most box or breakout tools stop at drawing a rectangle or marking the first break beyond a level. Darvas Box Breakout Quality adds structure, scoring, and failure awareness.
Core differentiators:
• Darvas-first structure logic
The rectangle is not a generic support/resistance zone. It comes from a Darvas box formation process built around a fresh seed high, containment, age, and volatility-adjusted box height.
• Compression quality
The script measures whether the box has enough maturity and controlled range behavior before treating it as a meaningful active structure.
• Breakout quality score
Every qualified breakout is evaluated with a 0-100 model that includes compression quality, relative volume, breakout distance, candle body participation, and directional close location.
• Volume confirmation
Breakout labels can require volume support, helping separate stronger participation events from weaker boundary pokes.
• Failed-break tracking
After breakout, the script watches whether price returns back inside the former box within the selected failure window. If it does, the event is marked as a failed break.
• Premium visual restraint
The default chart view uses one active box, compact labels, controlled label spacing, and a compact AGPro panel. The goal is to make the chart informative without making it noisy.
🧭 WHY THIS DOES NOT OVERLAP WITH OTHER AGPRO TOOLS
This script is intentionally separated from the existing AGPro breakout and chart-pattern family.
It is not Inside Bar Breakout Quality, because it does not require a mother bar or inside-bar compression sequence.
It is not Donchian Breakout Quality, because it is not based on rolling channel highs and lows.
It is not Opening Range Breakout logic, because it is not tied to a session-defined range.
It is not Triangle Breakout Quality, because it does not use converging pivot boundaries, apex pressure, or diagonal structure.
It is not Breakout Volume Quality, because volume is only one part of the confirmation model, not the entire concept.
It is not a supply/demand, order-block, or generic support/resistance zone script. The rectangle exists only when the Darvas box formation process supports it.
That distinction matters visually and analytically. On the chart, this script tells a Darvas story: rectangular compression, active box behavior, quality of release, and failed-break review.
⚙️ METHODOLOGY
1. Darvas seed detection
The script looks for a fresh high over the selected lookback period. This high becomes the initial reference for a potential Darvas box.
2. Box formation
After the seed appears, price must spend enough time contained beneath the upper boundary while the lower boundary develops. The box remains in formation until it meets the selected age and height requirements.
3. Volatility normalization
The box height is measured relative to ATR. This helps filter boxes that are too flat to matter or too wide to represent clean compression.
4. Active box state
When the box qualifies, the script displays the active Darvas box and optional midpoint. The box projects forward so the active breakout boundary remains visible while price approaches it.
5. Breakout confirmation
A bullish breakout requires price to resolve above the Darvas top. A bearish breakout requires price to resolve below the Darvas bottom. Users can require close-based confirmation for stricter filtering.
6. Quality score
The breakout score combines:
• Compression quality
• Relative volume support
• ATR-normalized breakout distance
• Candle body participation
• Directional close location
7. Failed-break monitoring
After breakout, the script watches a defined number of bars. If price returns back inside the former Darvas boundary, the failed-break marker is printed.
📊 PANEL
The AGPro panel summarizes the current Darvas environment:
• Box Age
• Compression
• Breakout Side
• Volume Support
• Latest Quality / State
The first panel row follows the AGPro publication standard: one merged blue header row containing only the panel title. Panel location, panel theme, and panel font size are adjustable from settings.
🎛️ KEY INPUTS
Darvas Box Detection
• New High Lookback
• Minimum Box Age
• Maximum Box Age
• ATR Length
• Minimum Box Height ATR
• Maximum Box Height ATR
• Require Close Beyond Box
Breakout Quality
• Volume MA Length
• Volume Support Threshold
• Require Volume Support
• Target Break Distance ATR
• Minimum Breakout Score
• Failed Break Window
Visual Controls
• Show Active Darvas Box
• Show Box Midline
• Show Breakout Labels
• Show Failed Break Markers
• Keep Resolved Box
• Box Projection Bars
• Label Cooldown Bars
• Maximum Visible Labels
• Label Offset ATR
• Label Stack Offset ATR
• Label Font Size
Panel
• Panel Location
• Panel Theme
• Panel Font Size
🔍 HOW TO READ IT
When a Darvas box becomes active, the chart displays the live rectangular structure. The panel shows how old the box is, how compressed it is, and whether the latest environment has breakout direction or volume support.
When price resolves outside the box with enough quality, the chart prints a compact breakout label such as UP 79 or DN 75. The number represents the breakout quality score.
When price fails to hold outside the box and returns back inside during the selected failure window, the script prints a compact failed-break marker such as FAIL UP or FAIL DN.
The best readings come when the box is visually clear, compression is meaningful, and the breakout candle has both directional close quality and volume support.
🧩 BEST USE CASES
• Classic Darvas box formations
• Rectangular range compression
• Box breakout quality review
• Volume-backed breakout confirmation
• Failed-break review after a box release
• Clean chart-pattern study
• Multi-timeframe Darvas structure observation
• Screenshot-friendly public chart analysis
🧠 VISUAL DESIGN PHILOSOPHY
Darvas Box Breakout Quality is designed to look premium through restraint.
The script avoids filling the chart with old boxes by default. It keeps the active Darvas box as the main visual layer, uses short event labels, adds cooldown and stack spacing to reduce overlap, and keeps the panel compact.
This makes the indicator easier to publish, easier to read, and easier to use across different symbols and timeframes.
🔔 ALERTS
The script includes alert conditions for:
• High-quality bullish Darvas breakout
• High-quality bearish Darvas breakout
• Failed bullish Darvas breakout
• Failed bearish Darvas breakout
These alerts follow the same structure-aware logic used by the chart labels.
🔹 LIMITATIONS AND TRANSPARENCY
Darvas box detection is structure-based and depends on the selected lookback, age, and ATR filters. Changing those settings can make the script more selective or more active.
Volume support depends on the quality of the symbol's volume feed. On instruments where volume is less informative, users may prefer to adjust the volume threshold or disable the volume requirement.
The score is a structured description of breakout quality according to the script's internal model. It is designed to help compare Darvas box releases by quality, not to replace the user's broader market context.
✅ IDEAL USER
This script is designed for traders who want a focused Darvas box tool with cleaner structure detection, breakout quality scoring, volume confirmation, failed-break awareness, and a premium chart layout.
It is best suited for users who want the Darvas box itself to remain the main story on the chart.
🔹 OVERVIEW
Darvas Box Breakout Quality [AGPro Series] is built for one of the most recognizable and widely searched chart-pattern structures in technical analysis: the Darvas Box.
The script focuses on the full Darvas lifecycle:
Box formation → compression quality → breakout direction → volume support → failed-break behavior.
Instead of treating every horizontal range as support and resistance, this script waits for a Darvas-style structure to form, validates the box by age and volatility-adjusted height, then evaluates how price resolves from that box. The result is a clean chart-pattern workflow designed for traders who want to study rectangular compression and breakout quality without turning the chart into a crowded zone map.
The main visual element is the active Darvas box itself. By default, resolved boxes are removed after breakout so the chart stays focused on the current live structure instead of filling with old rectangles.
🔹 WHAT MAKES IT DIFFERENT
Most box or breakout tools stop at drawing a rectangle or marking the first break beyond a level. Darvas Box Breakout Quality adds structure, scoring, and failure awareness.
Core differentiators:
• Darvas-first structure logic
The rectangle is not a generic support/resistance zone. It comes from a Darvas box formation process built around a fresh seed high, containment, age, and volatility-adjusted box height.
• Compression quality
The script measures whether the box has enough maturity and controlled range behavior before treating it as a meaningful active structure.
• Breakout quality score
Every qualified breakout is evaluated with a 0-100 model that includes compression quality, relative volume, breakout distance, candle body participation, and directional close location.
• Volume confirmation
Breakout labels can require volume support, helping separate stronger participation events from weaker boundary pokes.
• Failed-break tracking
After breakout, the script watches whether price returns back inside the former box within the selected failure window. If it does, the event is marked as a failed break.
• Premium visual restraint
The default chart view uses one active box, compact labels, controlled label spacing, and a compact AGPro panel. The goal is to make the chart informative without making it noisy.
🧭 WHY THIS DOES NOT OVERLAP WITH OTHER AGPRO TOOLS
This script is intentionally separated from the existing AGPro breakout and chart-pattern family.
It is not Inside Bar Breakout Quality, because it does not require a mother bar or inside-bar compression sequence.
It is not Donchian Breakout Quality, because it is not based on rolling channel highs and lows.
It is not Opening Range Breakout logic, because it is not tied to a session-defined range.
It is not Triangle Breakout Quality, because it does not use converging pivot boundaries, apex pressure, or diagonal structure.
It is not Breakout Volume Quality, because volume is only one part of the confirmation model, not the entire concept.
It is not a supply/demand, order-block, or generic support/resistance zone script. The rectangle exists only when the Darvas box formation process supports it.
That distinction matters visually and analytically. On the chart, this script tells a Darvas story: rectangular compression, active box behavior, quality of release, and failed-break review.
⚙️ METHODOLOGY
1. Darvas seed detection
The script looks for a fresh high over the selected lookback period. This high becomes the initial reference for a potential Darvas box.
2. Box formation
After the seed appears, price must spend enough time contained beneath the upper boundary while the lower boundary develops. The box remains in formation until it meets the selected age and height requirements.
3. Volatility normalization
The box height is measured relative to ATR. This helps filter boxes that are too flat to matter or too wide to represent clean compression.
4. Active box state
When the box qualifies, the script displays the active Darvas box and optional midpoint. The box projects forward so the active breakout boundary remains visible while price approaches it.
5. Breakout confirmation
A bullish breakout requires price to resolve above the Darvas top. A bearish breakout requires price to resolve below the Darvas bottom. Users can require close-based confirmation for stricter filtering.
6. Quality score
The breakout score combines:
• Compression quality
• Relative volume support
• ATR-normalized breakout distance
• Candle body participation
• Directional close location
7. Failed-break monitoring
After breakout, the script watches a defined number of bars. If price returns back inside the former Darvas boundary, the failed-break marker is printed.
📊 PANEL
The AGPro panel summarizes the current Darvas environment:
• Box Age
• Compression
• Breakout Side
• Volume Support
• Latest Quality / State
The first panel row follows the AGPro publication standard: one merged blue header row containing only the panel title. Panel location, panel theme, and panel font size are adjustable from settings.
🎛️ KEY INPUTS
Darvas Box Detection
• New High Lookback
• Minimum Box Age
• Maximum Box Age
• ATR Length
• Minimum Box Height ATR
• Maximum Box Height ATR
• Require Close Beyond Box
Breakout Quality
• Volume MA Length
• Volume Support Threshold
• Require Volume Support
• Target Break Distance ATR
• Minimum Breakout Score
• Failed Break Window
Visual Controls
• Show Active Darvas Box
• Show Box Midline
• Show Breakout Labels
• Show Failed Break Markers
• Keep Resolved Box
• Box Projection Bars
• Label Cooldown Bars
• Maximum Visible Labels
• Label Offset ATR
• Label Stack Offset ATR
• Label Font Size
Panel
• Panel Location
• Panel Theme
• Panel Font Size
🔍 HOW TO READ IT
When a Darvas box becomes active, the chart displays the live rectangular structure. The panel shows how old the box is, how compressed it is, and whether the latest environment has breakout direction or volume support.
When price resolves outside the box with enough quality, the chart prints a compact breakout label such as UP 79 or DN 75. The number represents the breakout quality score.
When price fails to hold outside the box and returns back inside during the selected failure window, the script prints a compact failed-break marker such as FAIL UP or FAIL DN.
The best readings come when the box is visually clear, compression is meaningful, and the breakout candle has both directional close quality and volume support.
🧩 BEST USE CASES
• Classic Darvas box formations
• Rectangular range compression
• Box breakout quality review
• Volume-backed breakout confirmation
• Failed-break review after a box release
• Clean chart-pattern study
• Multi-timeframe Darvas structure observation
• Screenshot-friendly public chart analysis
🧠 VISUAL DESIGN PHILOSOPHY
Darvas Box Breakout Quality is designed to look premium through restraint.
The script avoids filling the chart with old boxes by default. It keeps the active Darvas box as the main visual layer, uses short event labels, adds cooldown and stack spacing to reduce overlap, and keeps the panel compact.
This makes the indicator easier to publish, easier to read, and easier to use across different symbols and timeframes.
🔔 ALERTS
The script includes alert conditions for:
• High-quality bullish Darvas breakout
• High-quality bearish Darvas breakout
• Failed bullish Darvas breakout
• Failed bearish Darvas breakout
These alerts follow the same structure-aware logic used by the chart labels.
🔹 LIMITATIONS AND TRANSPARENCY
Darvas box detection is structure-based and depends on the selected lookback, age, and ATR filters. Changing those settings can make the script more selective or more active.
Volume support depends on the quality of the symbol's volume feed. On instruments where volume is less informative, users may prefer to adjust the volume threshold or disable the volume requirement.
The score is a structured description of breakout quality according to the script's internal model. It is designed to help compare Darvas box releases by quality, not to replace the user's broader market context.
✅ IDEAL USER
This script is designed for traders who want a focused Darvas box tool with cleaner structure detection, breakout quality scoring, volume confirmation, failed-break awareness, and a premium chart layout.
It is best suited for users who want the Darvas box itself to remain the main story on the chart.
Note di rilascio
🔧 UPDATE NOTES - V1.2This update focuses on visual clarity, panel standardization, and publication polish.
The core purpose of the script remains unchanged.
This release improves how Darvas boxes, breakout quality, volume support, and failed-break behavior are presented on the chart.
This script continues to function as an analytical and visualization tool.
It does not attempt to predict price direction or provide guaranteed outcomes.
------------------------
What Changed
------------------------
• Added centered Darvas box badge
The active Darvas box can now display a separate centered DARVAS BOX badge for cleaner first-glance interpretation.
• Standardized panel controls
Panel visibility, location, theme, and font-size controls have been aligned with current AGPro interface standards.
• Expanded layout options
Panel locations now include top, middle, and bottom center options.
• Expanded font-size controls
Label and panel font controls now support Tiny, Small, Normal, Large, and Huge.
• Preserved core breakout logic
Darvas box formation, compression score, breakout quality score, volume support, failed-break tracking, and alerts remain intact.
------------------------
Visual Improvements
------------------------
• Improved chart readability by adding a separate centered box badge
• Kept box text outside box object payloads for cleaner rendering and easier maintenance
• Refined panel theme behavior for dark, slate, and light chart environments
• Preserved breakout and failed-break labels while improving interface consistency
------------------------
Interface & Usability
------------------------
• Added Show Panel control with default enabled
• Added live panel position updates
• Preserved the single merged blue panel header row with the script name only
• Improved panel color handling across Elite Dark, Slate, and Clean Light themes
------------------------
Behavior Notes
------------------------
This update does not change the core analytical logic of the script.
The goal is to improve clarity and usability, not to introduce new predictive behavior.
Users should interpret outputs the same way as before, but with improved visual structure.
------------------------
Limitations Reminder
------------------------
The script remains a rule-based analytical tool.
Market conditions such as volatility, liquidity, and timeframe differences may affect how boxes and breakout labels appear.
Outputs should always be interpreted within broader market context.
------------------------
Risk Reminder
------------------------
This script is for educational and analytical purposes only.
It does not provide financial advice or guaranteed trading outcomes.
Users remain responsible for their own decisions.
Note di rilascio
UPDATE NOTES - v1.3This update focuses on readability and presentation.
The core purpose of the script remains unchanged. This release refines how the
existing Darvas box detection and breakout grading are presented on the chart.
This script continues to function as an analytical and visualization tool. It
does not attempt to predict price direction or provide guaranteed outcomes.
------------------------
What Changed
------------------------
- Breakout labels now show the quality grade
Each qualified breakout label now displays the quality grade letter alongside
the 0-100 score (for example "UP 68 B"), matching the grade shown in the
panel. This makes the breakout quality readable at a single glance.
- Stronger active box presence
The active Darvas box border was made slightly more prominent so the live
structure reads clearly as the focal point of the chart.
------------------------
Visual Improvements
------------------------
- Improved first-glance readability of breakout quality by tying the on-chart
label to the panel grade.
- Refined visual hierarchy so the active Darvas box stands out as the primary
structure.
- Preserved label offsets and stacking that keep labels above or below candles.
------------------------
Interface & Usability
------------------------
- Improved consistency between the on-chart labels and the summary panel.
- Adjusted default visual settings for a more balanced, premium appearance.
- Enhanced overall user experience without changing core logic.
------------------------
Behavior Notes
------------------------
This update does not change the core analytical logic of the script.
The goal is to improve clarity and usability, not to introduce new predictive
behavior. Darvas box detection, the compression and breakout quality scoring,
the volume model, the failed-break tracking, and the panel all behave exactly as
before.
Users should interpret outputs the same way as before, but with a clearer
quality read.
------------------------
Limitations Reminder
------------------------
The script remains a rule-based analytical tool.
Market conditions such as volatility, liquidity, and timeframe differences may
affect how boxes, breakouts, and failures appear. Outputs should always be
interpreted within broader market context.
------------------------
Risk Reminder
------------------------
This script is for educational and analytical purposes only.
It does not provide financial advice or guaranteed trading outcomes. Users
remain responsible for their own decisions.
Note di rilascio
🔧 UPDATE NOTES - v1.4This update focuses on reliability transparency and label-contrast consistency.
The core purpose of the script remains unchanged. This release adds a self-measured breakout follow-through rate and standardizes label contrast. It continues to function as an analytical and visualization tool. It does not attempt to predict price direction or provide guaranteed outcomes.
------------------------
What Changed
------------------------
• Added a Breakout Hit Rate readout.
After each qualified breakout, the script waits a configurable proof window and checks whether price is still beyond the broken Darvas boundary in the breakout direction, then reports an honest, self-measured follow-through rate in the panel.
• Standardized label contrast.
Breakout labels, failed-break markers, and the centered box badge now compute readable text color automatically from their background, improving legibility across both bullish and bearish event colors.
• Hardened the volatility reference.
The ATR baseline now falls back to true range on early bars, keeping box sizing, scoring, and label spacing stable from the very first candles.
------------------------
Visual Improvements
------------------------
• Improved breakout and failed-break label contrast across event colors.
• Preserved the single active Darvas box with its centered structure badge.
• Kept label density capped and offset from candles for a premium chart.
• Maintained the clean box, midline, and projection presentation.
------------------------
Interface & Usability
------------------------
• Added a Breakout Hit Rate row to the panel for at-a-glance reliability context.
• Improved readability of every on-chart label and badge.
• Kept panel layout and information flow consistent and easy to scan.
• Enhanced overall user experience without changing the core detection or scoring logic.
------------------------
Behavior Notes
------------------------
This update does not change the core analytical logic of the script.
The goal is to improve clarity and reliability transparency, not to introduce new predictive behavior.
Users should interpret outputs the same way as before, now with an added follow-through reference.
------------------------
Limitations Reminder
------------------------
The script remains a rule-based analytical tool.
Market conditions such as volatility, liquidity, and timeframe differences may affect how boxes, breakouts, failures, and the hit rate appear.
Outputs should always be interpreted within broader market context.
------------------------
Risk Reminder
------------------------
This script is for educational and analytical purposes only.
It does not provide financial advice or guaranteed trading outcomes.
Users remain responsible for their own decisions.
Script open-source
Nello spirito di TradingView, l'autore di questo script lo ha reso open source, in modo che i trader possano esaminarne e verificarne la funzionalità. Complimenti all'autore! Sebbene sia possibile utilizzarlo gratuitamente, ricordiamo che la ripubblicazione del codice è soggetta al nostro Regolamento.

Public-free scripts + invite-only AGPro workflows for market analysis, liquidity context, risk planning and execution review.
Rules-based. No hype. No guesswork.
Library & access: agprolabs.com/
Telegram: t.me/agprolabs
Rules-based. No hype. No guesswork.
Library & access: agprolabs.com/
Telegram: t.me/agprolabs
Declinazione di responsabilità
Le informazioni e le pubblicazioni non sono intese come, e non costituiscono, consulenza o raccomandazioni finanziarie, di investimento, di trading o di altro tipo fornite o approvate da TradingView. Per ulteriori informazioni, consultare i Termini di utilizzo.
Script open-source
Nello spirito di TradingView, l'autore di questo script lo ha reso open source, in modo che i trader possano esaminarne e verificarne la funzionalità. Complimenti all'autore! Sebbene sia possibile utilizzarlo gratuitamente, ricordiamo che la ripubblicazione del codice è soggetta al nostro Regolamento.
Public-free scripts + invite-only AGPro workflows for market analysis, liquidity context, risk planning and execution review.
Rules-based. No hype. No guesswork.
Library & access: agprolabs.com/
Telegram: t.me/agprolabs
Rules-based. No hype. No guesswork.
Library & access: agprolabs.com/
Telegram: t.me/agprolabs
Declinazione di responsabilità
Le informazioni e le pubblicazioni non sono intese come, e non costituiscono, consulenza o raccomandazioni finanziarie, di investimento, di trading o di altro tipo fornite o approvate da TradingView. Per ulteriori informazioni, consultare i Termini di utilizzo.