OPEN-SOURCE SCRIPT
OB + 2G2R + EMA/BB/ST/VWAP + Doji + Day Levels
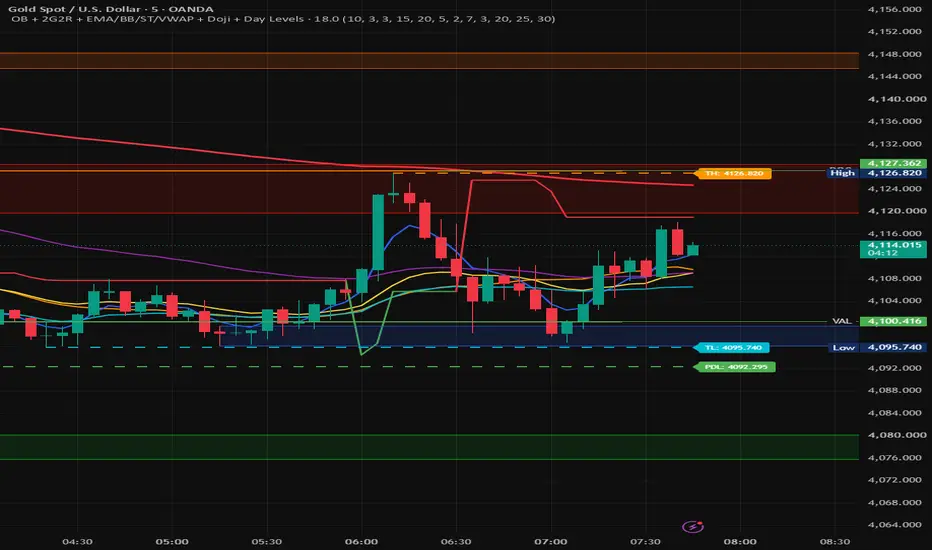
It is a multi-signal chart indicator. It does not place trades automatically; it plots trend tools, levels, and buy/sell markers.
It shows:
BB Mid — the 20-period SMA, used as the crossover reference.
EMA 5, EMA 20, EMA 50, EMA 200 — trend direction filters.
SuperTrend — green when bullish and red when bearish.
Today’s High and Today’s Low — running intraday high/low levels, updated as new candles form.
EMA BUY — EMA 5 crosses above BB Mid, the candle is bullish, and price is above EMA 20/50/200.
EMA SELL — EMA 5 crosses below BB Mid, the candle is bearish, and price is below EMA 20/50/200.
ST BUY / ST SELL — SuperTrend direction changes and the current candle breaks the previous candle’s high or low.
2R2G BUY — two bearish candles followed by two bullish candles.
2G2R SELL — two bullish candles followed by two bearish candles.
Doji Buy / Sell setups — a bullish-to-bearish or bearish-to-bullish two-candle sequence followed by a small-body doji.
The signals are independent. For example, a 2R2G marker does not require an EMA crossover or SuperTrend confirmation. The strongest practical use is to treat EMA trend, SuperTrend direction, and the candle pattern as confirmation together rather than entering on every marker.
It shows:
BB Mid — the 20-period SMA, used as the crossover reference.
EMA 5, EMA 20, EMA 50, EMA 200 — trend direction filters.
SuperTrend — green when bullish and red when bearish.
Today’s High and Today’s Low — running intraday high/low levels, updated as new candles form.
EMA BUY — EMA 5 crosses above BB Mid, the candle is bullish, and price is above EMA 20/50/200.
EMA SELL — EMA 5 crosses below BB Mid, the candle is bearish, and price is below EMA 20/50/200.
ST BUY / ST SELL — SuperTrend direction changes and the current candle breaks the previous candle’s high or low.
2R2G BUY — two bearish candles followed by two bullish candles.
2G2R SELL — two bullish candles followed by two bearish candles.
Doji Buy / Sell setups — a bullish-to-bearish or bearish-to-bullish two-candle sequence followed by a small-body doji.
The signals are independent. For example, a 2R2G marker does not require an EMA crossover or SuperTrend confirmation. The strongest practical use is to treat EMA trend, SuperTrend direction, and the candle pattern as confirmation together rather than entering on every marker.
Script open-source
Nello spirito di TradingView, l'autore di questo script lo ha reso open source, in modo che i trader possano esaminarne e verificarne la funzionalità. Complimenti all'autore! Sebbene sia possibile utilizzarlo gratuitamente, ricordiamo che la ripubblicazione del codice è soggetta al nostro Regolamento.

Declinazione di responsabilità
Le informazioni e le pubblicazioni non sono intese come, e non costituiscono, consulenza o raccomandazioni finanziarie, di investimento, di trading o di altro tipo fornite o approvate da TradingView. Per ulteriori informazioni, consultare i Termini di utilizzo.
Script open-source
Nello spirito di TradingView, l'autore di questo script lo ha reso open source, in modo che i trader possano esaminarne e verificarne la funzionalità. Complimenti all'autore! Sebbene sia possibile utilizzarlo gratuitamente, ricordiamo che la ripubblicazione del codice è soggetta al nostro Regolamento.
Declinazione di responsabilità
Le informazioni e le pubblicazioni non sono intese come, e non costituiscono, consulenza o raccomandazioni finanziarie, di investimento, di trading o di altro tipo fornite o approvate da TradingView. Per ulteriori informazioni, consultare i Termini di utilizzo.