OPEN-SOURCE SCRIPT
Fear & Greed Index
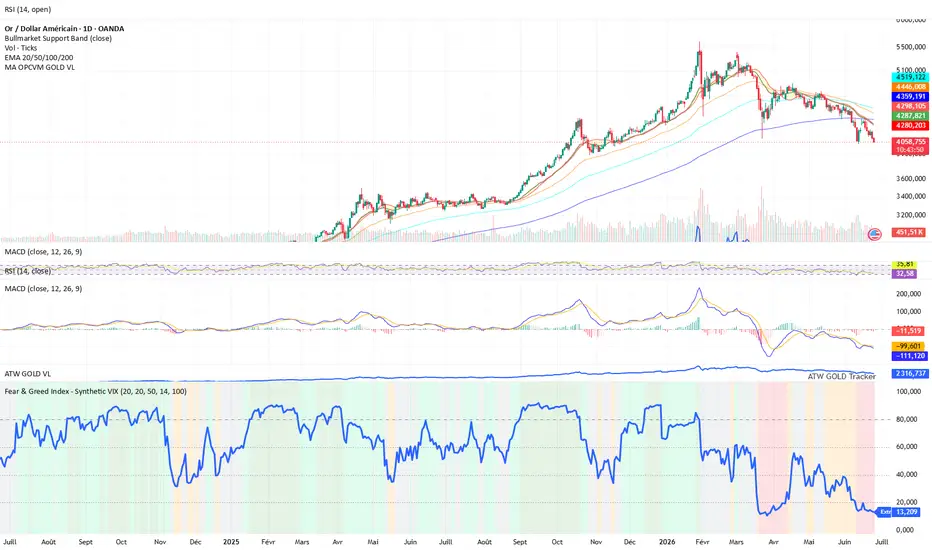
The Fear & Greed Index is a synthetic market sentiment indicator designed to convert multiple technical signals into a single 0–100 score.
Its purpose is to quickly identify market phases of fear, neutrality, or greed across any asset or index.
This indicator does not rely on an official VIX.
Instead, it uses synthetic realized volatility, combined with trend and momentum metrics, to provide a visual reading of market sentiment and regime conditions.
Methodology
The score is built from several components:
Realized volatility
used as a market stress proxy: higher volatility pushes the index toward fear.
Momentum
captures recent price acceleration or deterioration.
RSI
evaluates market strength and overbought / oversold conditions.
Trend vs moving average
compares current price to its moving average to assess directional bias.
Drawdown
measures the distance from recent highs to identify stress, correction, or recovery phases.
Score interpretation
The final score is normalized between 0 and 100:
0 – 20 → Extreme Fear
20 – 40 → Fear
40 – 60 → Neutral
60 – 80 → Greed
80 – 100 → Extreme Greed
How to use it
Low readings usually reflect stressed, volatile, or corrective market conditions.
High readings usually reflect confident, bullish, or potentially overheated market conditions.
The indicator is best used as a market regime / sentiment filter, not as a standalone buy or sell signal.
Disclaimer
This script is a synthetic sentiment indicator based on price and volume data.
It is not an official volatility index and should not be considered investment advice.
Its purpose is to quickly identify market phases of fear, neutrality, or greed across any asset or index.
This indicator does not rely on an official VIX.
Instead, it uses synthetic realized volatility, combined with trend and momentum metrics, to provide a visual reading of market sentiment and regime conditions.
Methodology
The score is built from several components:
Realized volatility
used as a market stress proxy: higher volatility pushes the index toward fear.
Momentum
captures recent price acceleration or deterioration.
RSI
evaluates market strength and overbought / oversold conditions.
Trend vs moving average
compares current price to its moving average to assess directional bias.
Drawdown
measures the distance from recent highs to identify stress, correction, or recovery phases.
Score interpretation
The final score is normalized between 0 and 100:
0 – 20 → Extreme Fear
20 – 40 → Fear
40 – 60 → Neutral
60 – 80 → Greed
80 – 100 → Extreme Greed
How to use it
Low readings usually reflect stressed, volatile, or corrective market conditions.
High readings usually reflect confident, bullish, or potentially overheated market conditions.
The indicator is best used as a market regime / sentiment filter, not as a standalone buy or sell signal.
Disclaimer
This script is a synthetic sentiment indicator based on price and volume data.
It is not an official volatility index and should not be considered investment advice.
Script open-source
Nello spirito di TradingView, l'autore di questo script lo ha reso open source, in modo che i trader possano esaminarne e verificarne la funzionalità. Complimenti all'autore! Sebbene sia possibile utilizzarlo gratuitamente, ricordiamo che la ripubblicazione del codice è soggetta al nostro Regolamento.

Declinazione di responsabilità
Le informazioni e le pubblicazioni non sono intese come, e non costituiscono, consulenza o raccomandazioni finanziarie, di investimento, di trading o di altro tipo fornite o approvate da TradingView. Per ulteriori informazioni, consultare i Termini di utilizzo.
Script open-source
Nello spirito di TradingView, l'autore di questo script lo ha reso open source, in modo che i trader possano esaminarne e verificarne la funzionalità. Complimenti all'autore! Sebbene sia possibile utilizzarlo gratuitamente, ricordiamo che la ripubblicazione del codice è soggetta al nostro Regolamento.
Declinazione di responsabilità
Le informazioni e le pubblicazioni non sono intese come, e non costituiscono, consulenza o raccomandazioni finanziarie, di investimento, di trading o di altro tipo fornite o approvate da TradingView. Per ulteriori informazioni, consultare i Termini di utilizzo.