OPEN-SOURCE SCRIPT
Modern Bollinger Bands [GBB]
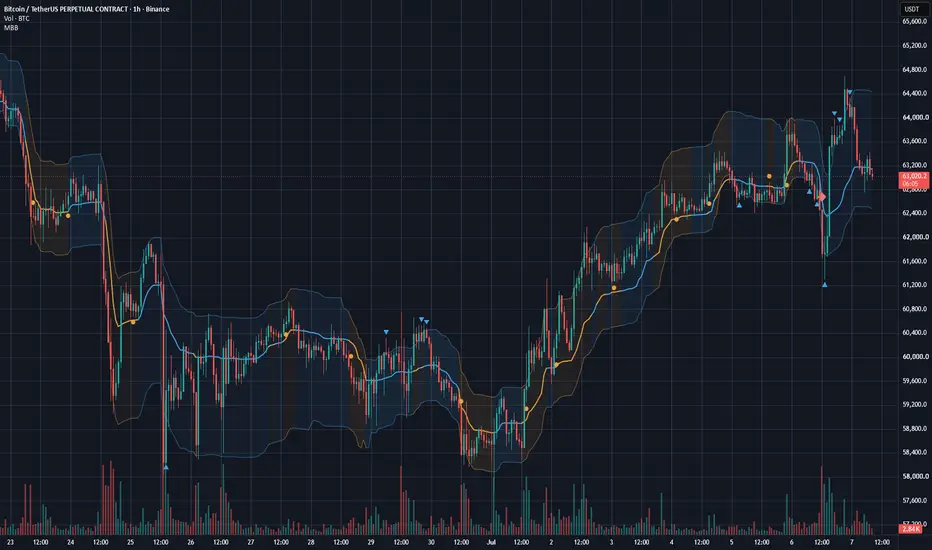
Modern Bollinger Bands [GBB]
I rebuilt Bollinger Bands. Not because the original is bad, John Bollinger's work has held up for forty years, but because the defaults everyone uses were designed for daily stock charts in the 1980s and we're putting them on crypto perps at 3am.
WHAT'S WRONG WITH THE CLASSIC
Five things, in my view.
The window is always 20 bars. Doesn't matter if the market is in a fast news week or a dead summer range, you get the same 20.
The bands assume returns follow a bell curve. Asset returns have fat tails, so price pokes outside a two sigma band far more often than the theory says it should.
A band touch has no meaning on its own. In a range, fading the touch works okay. In a trend, price walks down the band and runs over every single fade. The classic gives you nothing to tell those two situations apart, and that's the flaw that costs people real money.
The SMA basis is slow. Equal weight on every bar means the middle line describes the market as it was roughly ten bars ago.
And band width isn't comparable to anything. What counts as narrow on one chart means nothing on another, so squeeze thresholds end up being eyeballed.
WHAT I CHANGED
The length adapts. An Ehlers homodyne discriminator measures the dominant cycle in price and the window becomes half of it, between 10 and 50 bars. When there's no measurable cycle because the market is trending too hard, the length freezes at the last good value instead of guessing.
The basis is a KAMA instead of SMA. It speeds up when price is actually going somewhere and almost stops updating in chop.
The bands are percentile bands, not sigma bands. 97.5th and 2.5th percentile of the real deviations around the basis, nearest rank, over a longer window. Your market's actual tails, not a textbook bell curve.
I added a regime filter: Kaufman efficiency ratio, percentile ranked against the last 252 bars, with 70/55 hysteresis so it doesn't flip flop on the boundary. Blue bands are RANGE, orange bands are TREND, and the signals respect the color.
And the squeeze is a score from 0 to 100. Percentile rank of band width against the last year of bars. A score of 8 reads the same on every symbol and every timeframe.
THE SIGNALS
Three types, that only trigger on candle close, so there is nothing repainted.
Singal1: Blue triangles. The classic fade, but only where it belongs. Price closes outside a band, the next bar closes back inside, and the regime is RANGE. In TREND this signal simply doesn't exist.
Singal2: Orange circles. Trend pullback. Price dips into a zone around the basis, then closes back in the trend direction. TREND only and with the trend only. One thing about the chart markers: in a long trend this setup can fire on several nearby bars, so the chart draws the first circle of a cluster and skips the repeats for a few bars, so the chart does not get too cluttered.
Signal3: Diamonds. Squeeze release after at least 5 bars of squeeze, then the squeeze ends and price closes outside a band on that same bar. Important: While this is the most intuitive setup of the three and it's the one my testing supports least. Release events showed the same forward 20 bar volatility as typical bars from the same hours. Volume confirmation didn't help either, I tested that separately. The diamonds mark a real event, compression ended and price left the bands, but whether that's worth anything is a question my data answered with no. I included the signal and alert for it anyway, because I know many of you will want it.
SETTINGS
Everything above is a toggle. The groups match the settings dialog, so here's what each one actually does and when you'd touch it.
Adaptive length: Length mode switches between Adaptive and Fixed. Adaptive is the point of this indicator. Fixed with the default of 20 exists for two reasons: reproducing the classic, and for people who want to trust their own number. The fixed length input only matters in Fixed mode.
Basis / bands: Basis picks KAMA or SMA for the middle line, bands picks Robust (percentile) or Stdev (classic sigma). Set Fixed 20 plus SMA plus Stdev and you have exact 1980s Bollinger Bands, that combination is deliberately supported. The stdev multiplier (2.0) only applies in Stdev mode. The robust percentiles (97.5 and 2.5) set where the bands sit in the deviation distribution, pull them toward 95/5 if you want more touches and more signals, push them out if you want only the extremes. The robust window multiplier and floor control how much history the percentile estimate uses, 4 times the adaptive length with a floor of 80 bars by default. Shorter windows react faster to volatility shifts but the tail estimates get noisy, I would leave these alone unless you know why you're changing them. KAMA fast and slow (2 and 30) are the standard Kaufman speeds, the basis moves between a 2 period and a 30 period EMA depending on how efficient the move is.
Regime / squeeze: KER length (20) is the window for the efficiency ratio itself. The percentile rank window (252) is what "recent history" means for both the regime and the squeeze score, about one year of daily bars, about ten days on 1h. TREND enter (70) and TREND exit (55) are the hysteresis levels: the market has to rank above the 70th percentile in efficiency to be called TREND and drop back below the 55th to be called RANGE again. Widen the gap and the regime switches less often but later, narrow it and you get earlier calls with more flip flops. These defaults sat on a flat plateau in sensitivity testing, meaning nearby values gave nearly identical results, so there's no magic in 70/55, but there's also nothing to gain from tuning them. Squeeze threshold (20) defines squeeze as band width below the 20th percentile, and min bars in squeeze (5) stops one bar dips from counting as compression.
Signals: One input, the S2 touch fraction (0.25). It sets how close to the basis a pullback has to come, measured as a fraction of the band halfwidth. Smaller means stricter pullbacks and fewer S2 signals.
Display: Clean display preset strips everything down to the three lines, no fill, no markers, no panel. The info panel (regime, KER percentile, adaptive length with its frozen flag, squeeze score, last signal) is off by default, turn it on when you want to see what the indicator is "thinking". Signal markers and the squeeze heat on the band fill can be switched off separately. The S2 marker debounce (5) is the cosmetic cluster filter from the signals section, set it to 0 if you want every circle drawn.
Parity: You can ignore this group for trading. It pins the computation start to a fixed timestamp so every value on the chart can be reproduced bar for bar against a Python reference implementation. It's how the validation was done and it stays in so anyone can check my work.
ALERTS
Six per signal alerts plus the combined JSON one with symbol, timeframe, signal, regime, squeeze score and band levels. Once per confirmed bar close, built for webhook bots.
No indicator prints money, this one included. It tells you regime, structure and volatility state, with the evidence behind each part published, nulls and all. Trade safe.
I rebuilt Bollinger Bands. Not because the original is bad, John Bollinger's work has held up for forty years, but because the defaults everyone uses were designed for daily stock charts in the 1980s and we're putting them on crypto perps at 3am.
WHAT'S WRONG WITH THE CLASSIC
Five things, in my view.
The window is always 20 bars. Doesn't matter if the market is in a fast news week or a dead summer range, you get the same 20.
The bands assume returns follow a bell curve. Asset returns have fat tails, so price pokes outside a two sigma band far more often than the theory says it should.
A band touch has no meaning on its own. In a range, fading the touch works okay. In a trend, price walks down the band and runs over every single fade. The classic gives you nothing to tell those two situations apart, and that's the flaw that costs people real money.
The SMA basis is slow. Equal weight on every bar means the middle line describes the market as it was roughly ten bars ago.
And band width isn't comparable to anything. What counts as narrow on one chart means nothing on another, so squeeze thresholds end up being eyeballed.
WHAT I CHANGED
The length adapts. An Ehlers homodyne discriminator measures the dominant cycle in price and the window becomes half of it, between 10 and 50 bars. When there's no measurable cycle because the market is trending too hard, the length freezes at the last good value instead of guessing.
The basis is a KAMA instead of SMA. It speeds up when price is actually going somewhere and almost stops updating in chop.
The bands are percentile bands, not sigma bands. 97.5th and 2.5th percentile of the real deviations around the basis, nearest rank, over a longer window. Your market's actual tails, not a textbook bell curve.
I added a regime filter: Kaufman efficiency ratio, percentile ranked against the last 252 bars, with 70/55 hysteresis so it doesn't flip flop on the boundary. Blue bands are RANGE, orange bands are TREND, and the signals respect the color.
And the squeeze is a score from 0 to 100. Percentile rank of band width against the last year of bars. A score of 8 reads the same on every symbol and every timeframe.
THE SIGNALS
Three types, that only trigger on candle close, so there is nothing repainted.
Singal1: Blue triangles. The classic fade, but only where it belongs. Price closes outside a band, the next bar closes back inside, and the regime is RANGE. In TREND this signal simply doesn't exist.
Singal2: Orange circles. Trend pullback. Price dips into a zone around the basis, then closes back in the trend direction. TREND only and with the trend only. One thing about the chart markers: in a long trend this setup can fire on several nearby bars, so the chart draws the first circle of a cluster and skips the repeats for a few bars, so the chart does not get too cluttered.
Signal3: Diamonds. Squeeze release after at least 5 bars of squeeze, then the squeeze ends and price closes outside a band on that same bar. Important: While this is the most intuitive setup of the three and it's the one my testing supports least. Release events showed the same forward 20 bar volatility as typical bars from the same hours. Volume confirmation didn't help either, I tested that separately. The diamonds mark a real event, compression ended and price left the bands, but whether that's worth anything is a question my data answered with no. I included the signal and alert for it anyway, because I know many of you will want it.
SETTINGS
Everything above is a toggle. The groups match the settings dialog, so here's what each one actually does and when you'd touch it.
Adaptive length: Length mode switches between Adaptive and Fixed. Adaptive is the point of this indicator. Fixed with the default of 20 exists for two reasons: reproducing the classic, and for people who want to trust their own number. The fixed length input only matters in Fixed mode.
Basis / bands: Basis picks KAMA or SMA for the middle line, bands picks Robust (percentile) or Stdev (classic sigma). Set Fixed 20 plus SMA plus Stdev and you have exact 1980s Bollinger Bands, that combination is deliberately supported. The stdev multiplier (2.0) only applies in Stdev mode. The robust percentiles (97.5 and 2.5) set where the bands sit in the deviation distribution, pull them toward 95/5 if you want more touches and more signals, push them out if you want only the extremes. The robust window multiplier and floor control how much history the percentile estimate uses, 4 times the adaptive length with a floor of 80 bars by default. Shorter windows react faster to volatility shifts but the tail estimates get noisy, I would leave these alone unless you know why you're changing them. KAMA fast and slow (2 and 30) are the standard Kaufman speeds, the basis moves between a 2 period and a 30 period EMA depending on how efficient the move is.
Regime / squeeze: KER length (20) is the window for the efficiency ratio itself. The percentile rank window (252) is what "recent history" means for both the regime and the squeeze score, about one year of daily bars, about ten days on 1h. TREND enter (70) and TREND exit (55) are the hysteresis levels: the market has to rank above the 70th percentile in efficiency to be called TREND and drop back below the 55th to be called RANGE again. Widen the gap and the regime switches less often but later, narrow it and you get earlier calls with more flip flops. These defaults sat on a flat plateau in sensitivity testing, meaning nearby values gave nearly identical results, so there's no magic in 70/55, but there's also nothing to gain from tuning them. Squeeze threshold (20) defines squeeze as band width below the 20th percentile, and min bars in squeeze (5) stops one bar dips from counting as compression.
Signals: One input, the S2 touch fraction (0.25). It sets how close to the basis a pullback has to come, measured as a fraction of the band halfwidth. Smaller means stricter pullbacks and fewer S2 signals.
Display: Clean display preset strips everything down to the three lines, no fill, no markers, no panel. The info panel (regime, KER percentile, adaptive length with its frozen flag, squeeze score, last signal) is off by default, turn it on when you want to see what the indicator is "thinking". Signal markers and the squeeze heat on the band fill can be switched off separately. The S2 marker debounce (5) is the cosmetic cluster filter from the signals section, set it to 0 if you want every circle drawn.
Parity: You can ignore this group for trading. It pins the computation start to a fixed timestamp so every value on the chart can be reproduced bar for bar against a Python reference implementation. It's how the validation was done and it stays in so anyone can check my work.
ALERTS
Six per signal alerts plus the combined JSON one with symbol, timeframe, signal, regime, squeeze score and band levels. Once per confirmed bar close, built for webhook bots.
No indicator prints money, this one included. It tells you regime, structure and volatility state, with the evidence behind each part published, nulls and all. Trade safe.
Script open-source
Nello spirito di TradingView, l'autore di questo script lo ha reso open source, in modo che i trader possano esaminarne e verificarne la funzionalità. Complimenti all'autore! Sebbene sia possibile utilizzarlo gratuitamente, ricordiamo che la ripubblicazione del codice è soggetta al nostro Regolamento.

The Good, the Bad and the Bitcoin — No hype, just data.
Free indicators & honest backtests: youtube.com/@TheGoodTheBadAndTheBitcoin
Free indicators & honest backtests: youtube.com/@TheGoodTheBadAndTheBitcoin
Declinazione di responsabilità
Le informazioni e le pubblicazioni non sono intese come, e non costituiscono, consulenza o raccomandazioni finanziarie, di investimento, di trading o di altro tipo fornite o approvate da TradingView. Per ulteriori informazioni, consultare i Termini di utilizzo.
Script open-source
Nello spirito di TradingView, l'autore di questo script lo ha reso open source, in modo che i trader possano esaminarne e verificarne la funzionalità. Complimenti all'autore! Sebbene sia possibile utilizzarlo gratuitamente, ricordiamo che la ripubblicazione del codice è soggetta al nostro Regolamento.
The Good, the Bad and the Bitcoin — No hype, just data.
Free indicators & honest backtests: youtube.com/@TheGoodTheBadAndTheBitcoin
Free indicators & honest backtests: youtube.com/@TheGoodTheBadAndTheBitcoin
Declinazione di responsabilità
Le informazioni e le pubblicazioni non sono intese come, e non costituiscono, consulenza o raccomandazioni finanziarie, di investimento, di trading o di altro tipo fornite o approvate da TradingView. Per ulteriori informazioni, consultare i Termini di utilizzo.