Aggiornato
PDH+PDL+Session Highs and Lows_MarkAlex
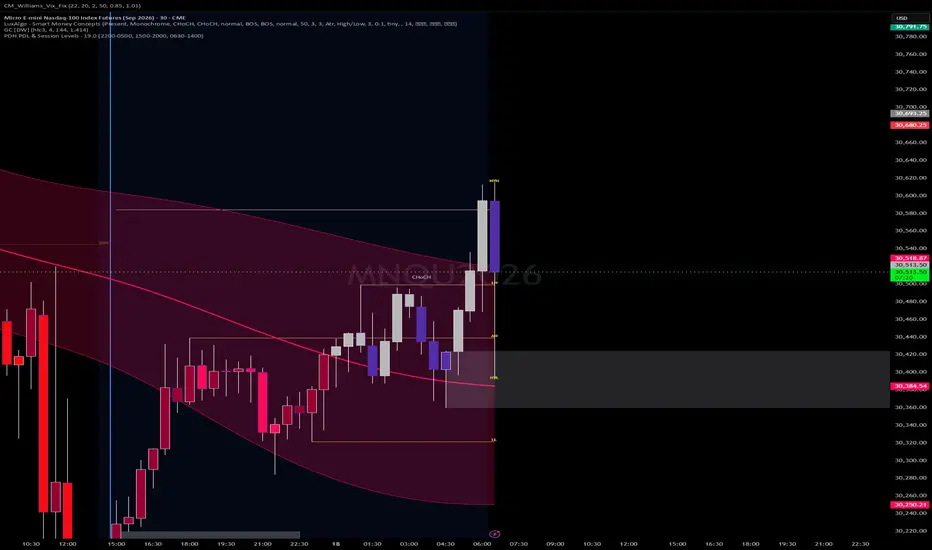
"PDH/PDL & Session Levels"
A clean multi-timeframe levels indicator that plots two types of horizontal reference lines anchored to their source candles and extending to the current bar:
Daily/Weekly/Monthly Levels — Draws the previous day high and low, previous week high and low, and the current daily, weekly, and monthly open prices as color-coded horizontal lines. Each line originates from the first bar of the current period and stretches to the current candle so you always see exactly how far price has traveled from those key levels. All seven levels are individually toggleable with custom colors.
Session Highs & Lows — Tracks the highest and lowest wick printed during each of the three major trading sessions — Asia (1pm–5pm MT), London (1am–6am MT), and New York (6:30am–3pm MT) — and draws a horizontal line anchored to the exact candle that made that high or low, extending to the current bar. Shows the last two occurrences of each session so you can compare back-to-back sessions. The most recent session is full color, the previous one is faded. All three sessions are individually toggleable with custom colors.
Note di rilascio
++ lower time frames
Declinazione di responsabilità
Le informazioni e le pubblicazioni non sono intese come, e non costituiscono, consulenza o raccomandazioni finanziarie, di investimento, di trading o di altro tipo fornite o approvate da TradingView. Per ulteriori informazioni, consultare i Termini di utilizzo.
Declinazione di responsabilità
Le informazioni e le pubblicazioni non sono intese come, e non costituiscono, consulenza o raccomandazioni finanziarie, di investimento, di trading o di altro tipo fornite o approvate da TradingView. Per ulteriori informazioni, consultare i Termini di utilizzo.