OTE Zones - Entry Depth Statistics [Dots3Red]
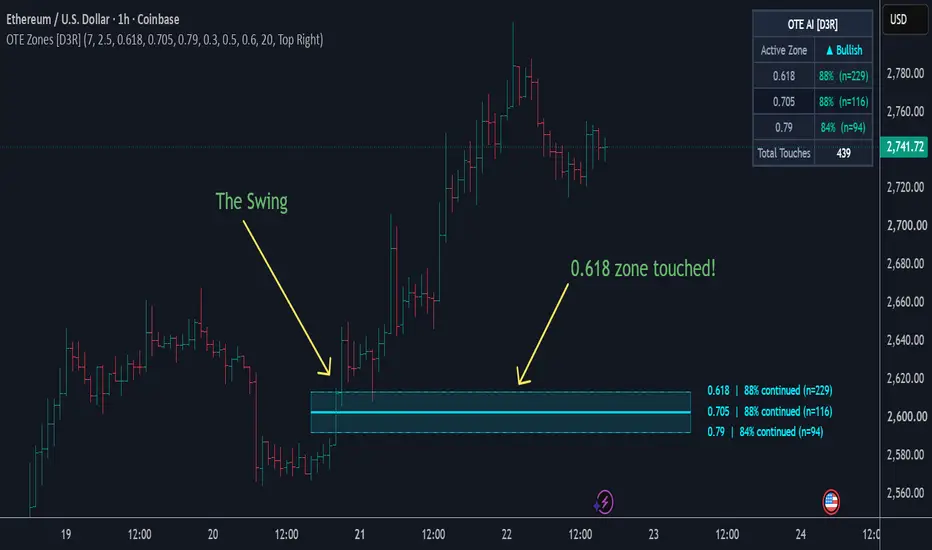
📏 OTE ZONES — ENTRY DEPTH STATISTICS [Dots3Red]
The Optimal Trade Entry zone, the 61.8% to 79% retracement pocket of a confirmed structural swing , is one of the most repeated ideas in ICT-style trading. Whether entries deeper in that pocket actually perform differently than shallow ones is rarely tested. This script checks it directly.
✨ WHY THIS MATTERS
"Deeper is better" is one of those trading assumptions that gets repeated until it sounds like fact. Nobody actually measures it, chart by chart, because doing so by hand would mean logging every swing, every retracement touch, and every outcome, by eye, over months. This script does that logging automatically and keeps the running score in view at all times.
📊 Every OTE touch, graded and tallied by depth
Each of the three retracement levels — shallow, mid, deep — carries its own independent, continuously updating count of touches and continuations. Example of the shape of the output:
0.618 (shallow): 55% continued (n=24)
0.705 (mid): 61% continued (n=19)
0.79 (deep): 64% continued (n=11)
That's not a guarantee of what those numbers will read on your chart — it updates continuously and is specific to the instrument, timeframe, and settings it's run with.
⚙️ HOW IT WORKS
📐 Structural swing detection — pivots are confirmed and a swing only qualifies once price has genuinely broken structure (closed beyond the prior pivot) and the leg is large enough, relative to ATR, to represent a real impulse rather than noise.
📏 Three independent OTE levels — shallow, mid, and deep retracement levels (defaults at 0.618 / 0.705 / 0.79, all independently editable) drawn as a zone between the swing's high and low.
🎯 Touch detection — when price re-enters the zone and comes within tolerance of one of the three levels, that touch is logged against its specific tier — nearest untested tier first.
🔒 Rolling, honest grading — each logged touch is graded only once its outcome window has closed: either price continued a defined distance in the original swing direction (counted as a continuation), or the window elapsed without that happening (counted as a non-continuation). A zone that gets invalidated — price closing back through the swing's origin — is discarded rather than graded, since the setup itself failed before conclusion.
🔒 Non-repainting — the swing, the zone, and every grading decision are all confirmed-bar only.
🧭 HOW TO USE
1️⃣ Let touches accumulate before reading the tiers. A tier showing "no touches yet" or a low n is not yet a meaningful statistic — the more touches logged, the more the percentage reflects a real tendency rather than a coincidence.
2️⃣ Compare the three tiers against each other, not against a fixed benchmark. The useful information is whether percentages step upward from shallow to deep, stay flat, or don't behave the way the "deeper is better" assumption predicts — any of those outcomes is a real answer.
3️⃣ Use the zone drawing as the visual reference, the dashboard as the running scoreboard. The chart shows where the current zone and levels sit; the table tracks history across every zone this chart has produced.
4️⃣ Treat a tier's win rate as descriptive, not predictive. It describes what has happened at that depth on this chart historically — not a guaranteed outcome for the next touch.
5️⃣ Adjust the levels to match your own framework. The three retracement percentages are inputs, not fixed constants — if your own approach uses different levels, set them and let the tool measure against your own definition.
⏱️ WHICH TIMEFRAMES WORK BEST
This method needs a meaningful number of resolved swings and touches to say anything statistically useful, which makes 15-minute through 4-hour the most balanced range — frequent enough for genuine structural swings to recur and build a sample within a reasonable window, while each swing still reflects real, settled price behavior rather than noise. Very short timeframes produce many low-quality swings even with the size filter; daily and higher timeframes produce meaningful swings too infrequently to build a sample in a practical amount of time.
🛠️ SETTINGS
📐 Swing & Structure — pivot leg length, minimum swing size (×ATR)
📏 OTE Levels — shallow, mid, and deep retracement levels, independently editable
🎯 Outcome Grading — touch tolerance, continuation confirmation distance, invalidation buffer, outcome window (bars)
🎨 Visualization — zone fill, tier stat labels, independent bullish/bearish colors
🖥️ Dashboard — show/hide, position — active zone direction, per-tier continuation rate and sample size, total touches
📝 NOTES
The percentages shown are specific to this chart, this timeframe, and these settings — they do not transfer to other instruments or configurations. The point of the tool is not to assert which retracement depth is "correct," but to replace that assumption with a measured answer for the chart you're actually trading.
⚠️ DISCLAIMER
This is an analytical and visualization tool. It does not generate trade signals and does not constitute financial advice. Historical statistics do not guarantee future performance.

Connect the dots to elevate your trading.
Declinazione di responsabilità
Le informazioni e le pubblicazioni non sono intese come, e non costituiscono, consulenza o raccomandazioni finanziarie, di investimento, di trading o di altro tipo fornite o approvate da TradingView. Per ulteriori informazioni, consultare i Termini di utilizzo.