Gann Levels (Fixed Yesterday Close Anchor) v6
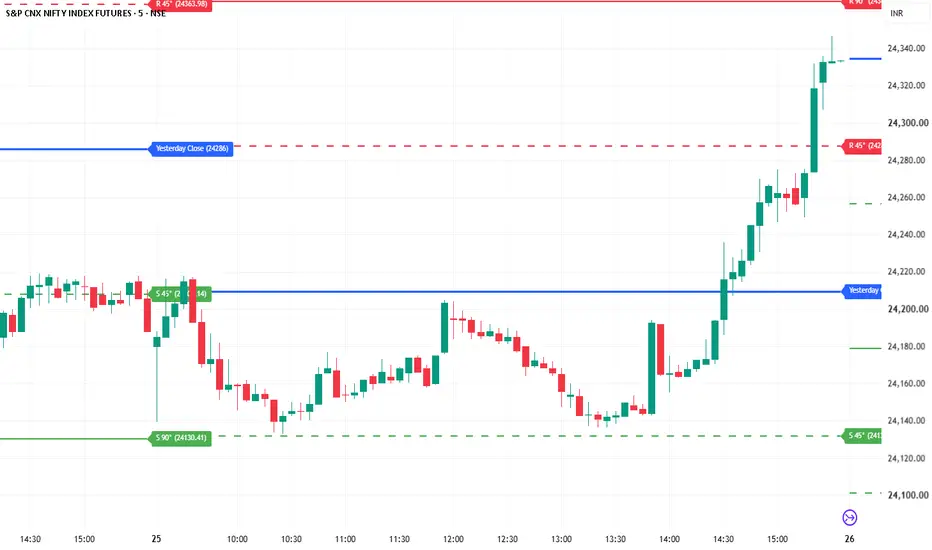
1. Mathematical Grounding (Gann Square of 9)
W.D. Gann’s core theory posits that price movement is governed by geometric relationships. The script calculates key support and resistance milestones by transforming the baseline price into degrees of a circle using the algebraic formula:
Gann Lvel = ((sqrt(Base Price) + Angle/180)^2
Base Price: The script extracts the exact finalized daily closing price from the previous session.
Angles Used: It computes full cardinal wheel checkpoints (90°, 180°, 270°, 360°) and sub-cardinal wheel checkpoints (45°, 135°, 225°, 315°).
Supports vs. Resistances: Resistances add the angle value factor to project higher targets, while supports subtract the factor to project lower target limits.
2. Bulletproof Drawing Engine (Zero Vertical Lines)
Traditional plot() routines create ugly, vertical "staircase" connecting lines when a new day opens and the level shifts. This final script completely eliminates that issue by utilizing Pine Script Drawing Lines.
Each day is treated as a completely isolated, independent visual block.At the start of the trading session, the indicator draws independent horizontal lines.
As new bars form throughout the day, the script smoothly extend only the current day's lines forward to the latest bar index, leaving historical days perfectly flat and disconnected.
3. Clear Visual HierarchyCardinal Angles (90°, 180°, 270°, 360°):
Rendered as solid lines because they represent heavy pivot zones. Major full-rotation levels (180° and 360°) are drawn slightly thicker.
Sub-Cardinal Angles (45°, 135°, 225°, 315°): Rendered as dashed lines to signify minor, fluid intraday target extensions.
Daily Close Baseline: Rendered as a distinct blue pivot line so you can easily visually track the starting baseline of the current day's ranges.
4. Dynamic Live Price Labels
Instead of forcing you to hover your mouse over the lines to read the values, the script embeds real-time text boxes (label.new) directly onto the rightmost edge of each horizontal ray. The text dynamically displays both the structural angle name and its exact mathematical price value (rounded to two decimal places, e.g., R 90° (152.45)), moving forward step-by-step alongside the active price candle.
W.D. Gann’s core theory posits that price movement is governed by geometric relationships. The script calculates key support and resistance milestones by transforming the baseline price into degrees of a circle using the algebraic formula:
Gann Lvel = ((sqrt(Base Price) + Angle/180)^2
Base Price: The script extracts the exact finalized daily closing price from the previous session.
Angles Used: It computes full cardinal wheel checkpoints (90°, 180°, 270°, 360°) and sub-cardinal wheel checkpoints (45°, 135°, 225°, 315°).
Supports vs. Resistances: Resistances add the angle value factor to project higher targets, while supports subtract the factor to project lower target limits.
2. Bulletproof Drawing Engine (Zero Vertical Lines)
Traditional plot() routines create ugly, vertical "staircase" connecting lines when a new day opens and the level shifts. This final script completely eliminates that issue by utilizing Pine Script Drawing Lines.
Each day is treated as a completely isolated, independent visual block.At the start of the trading session, the indicator draws independent horizontal lines.
As new bars form throughout the day, the script smoothly extend only the current day's lines forward to the latest bar index, leaving historical days perfectly flat and disconnected.
3. Clear Visual HierarchyCardinal Angles (90°, 180°, 270°, 360°):
Rendered as solid lines because they represent heavy pivot zones. Major full-rotation levels (180° and 360°) are drawn slightly thicker.
Sub-Cardinal Angles (45°, 135°, 225°, 315°): Rendered as dashed lines to signify minor, fluid intraday target extensions.
Daily Close Baseline: Rendered as a distinct blue pivot line so you can easily visually track the starting baseline of the current day's ranges.
4. Dynamic Live Price Labels
Instead of forcing you to hover your mouse over the lines to read the values, the script embeds real-time text boxes (label.new) directly onto the rightmost edge of each horizontal ray. The text dynamically displays both the structural angle name and its exact mathematical price value (rounded to two decimal places, e.g., R 90° (152.45)), moving forward step-by-step alongside the active price candle.

Declinazione di responsabilità
Le informazioni e le pubblicazioni non sono intese come, e non costituiscono, consulenza o raccomandazioni finanziarie, di investimento, di trading o di altro tipo fornite o approvate da TradingView. Per ulteriori informazioni, consultare i Termini di utilizzo.
Declinazione di responsabilità
Le informazioni e le pubblicazioni non sono intese come, e non costituiscono, consulenza o raccomandazioni finanziarie, di investimento, di trading o di altro tipo fornite o approvate da TradingView. Per ulteriori informazioni, consultare i Termini di utilizzo.