OPEN-SOURCE SCRIPT
Aggiornato NBSG_DayTradingSuite
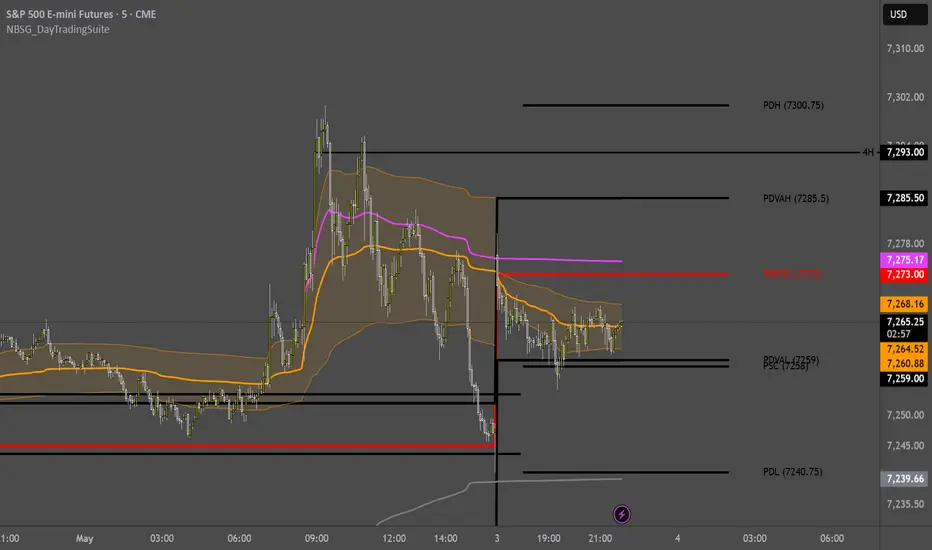
An all-in-one day trading overlay designed by a futures trader for futures traders. It consolidates the key levels, anchored VWAPs, session volume profiles, and structural references that intraday traders typically spread across 3-5 separate indicators into a single, configurable script.
Built and defaulted for CME futures (ES, MES, NQ, MNQ, and similar instruments), but the session times are fully adjustable in settings. Traders on equities, crypto, or forex can adapt the indicator to their instrument by configuring the session windows to match their market's electronic trading hours.
The default session times are set for a trader operating in US Central Time (Chicago time). If you trade in a different timezone, adjust the session inputs accordingly.
This indicator is not a signal generator. It plots structure so you can make your own decisions.
FEATURES
Multiple Anchored VWAPs
The indicator plots two independent session-anchored VWAPs, each with optional standard deviation bands:
Overnight VWAP (VWAP 1) anchors at 17:00 CT (CME session open) and accumulates across the entire futures trading day through 16:00 CT. It resets cleanly each session. Optional 1SD and 2SD bands with fill show the statistical envelope around the developing VWAP.
NY Session VWAP (VWAP 2) anchors at 08:30 CT (Regular Trading Hours open) and accumulates through 16:00 CT. It includes a leapfrog mechanic: when the new RTH session begins, the prior session's VWAP is preserved and continues to plot as "Prev NY VWAP," giving you a reference for how price relates to yesterday's value during overnight trading.
Prev NY VWAP: This is the previous day's NY Session VWAP, which continues accumulating through the overnight session after the NY VWAP resets at 08:30. It provides a critical structural reference, particularly during the premarket and early RTH, showing where the prior session's volume-weighted equilibrium sits relative to current price. Many traders use the relationship between current price, the active NY VWAP, and the Prev NY VWAP to gauge directional bias.
All VWAPs use separate source, color, and line size settings.
Higher Timeframe VWAPs
Optional Weekly and Monthly VWAP overlays provide broader context without cluttering the chart. Disabled by default.
Session Volume Profiles (SVP)
Volume is distributed across the bar's high-low range using a configurable tick-based bin size (default: 2 ticks). The script calculates and plots:
Current Session SVP: POC and Value Area (VAH/VAL) for the active session, updating in real time.
Prior Day SVP: POC and Value Area from the previous completed session. These levels carry forward as horizontal references.
Last Week SVP: POC and Value Area from the prior completed week.
Each profile can be displayed as POC Only or POC + VA. The Value Area percentage is configurable (default: 70%).
Static Reference Levels
Prior Day High/Low (PDH/PDL): Previous day's range boundaries.
Last Week High/Low (LWH/LWL): Previous week's range boundaries.
Previous Session Close (PSC): The prior day's closing price.
Premarket High/Low (PMH/PML): Dynamically tracked during the 18:00-08:30 premarket session.
Opening Range (ORH/ORL): The first 15 minutes of RTH (08:30-08:45), with optional fill.
All static levels are individually togglable with independent color and size controls.
Deadzone
A configurable time window (default: 11:00-13:00 CT) highlighted with a background fill and border lines. This marks the midday period where volume and follow-through typically thin out on equity index futures. The time window is adjustable in settings.
Bar Coloring
Optional bar coloring based on the close's relationship to the three primary VWAPs (Overnight, NY, Prev NY). Bars are colored bullish when above 2 of 3, bearish when below 2 of 3, and neutral otherwise. Disabled by default.
Display Modes
A master display mode toggle lets you switch between:
Advanced All-Level: Shows everything you have enabled, the full suite.
Simplified VWAP: Strips the chart down to just the Overnight VWAP, NY VWAP, Prev NY VWAP, and Opening Range. All volume profiles, static levels, and the deadzone are automatically hidden. Useful for cleaner charts or when you want to focus purely on VWAP structure.
Labels
Every plotted level gets a text label with optional price display, offset to the right of the current bar for readability. Labels can be globally toggled on/off.
HOW TO USE
1. Add the indicator to your chart on an intraday timeframe (1m-30m recommended). It is defaulted for CME futures but can be adapted to any instrument by adjusting the session time inputs.
2. The default session times are built for US Central Time (Chicago). If your chart uses a different timezone, adjust the session inputs in the settings to match your market's session boundaries.
3. The default configuration shows most levels. Start by reviewing what each level represents, then toggle off anything that creates noise for your specific approach.
4. For cleaner charts, switch to "Simplified VWAP" mode, which isolates the core VWAP structure and Opening Range only.
CONFIGURATION
All session times, colors, line sizes, and visibility toggles are individually configurable. The settings are organized into numbered groups for clarity:
1. Master Display Mode
2. Session Times
3. NY VWAP Settings
4. Overnight VWAP Settings
5. Opening Range
6. Volume Profiles (SVP)
7. Static Levels
8. Higher Timeframe VWAPs
9. Deadzone
10. Bar Coloring
11. Labels
LIMITATIONS
The default session times are configured for CME futures with the standard 17:00-16:00 CT (close enough) session structure. If you are using this on equities, crypto, forex, or other instruments, you will need to adjust the session time inputs to match your market's electronic trading hours. The indicator will work on any instrument, but the session boundaries must be set correctly for accurate VWAP anchoring and level calculation.
This is a feature-rich script with multiple VWAPs, volume profiles, and level calculations running simultaneously. Tradingview handles it well the vast majority of the time, but on occasion the script may load slowly or display incompletely. If levels appear missing or the indicator looks off, a simple page refresh will typically resolve it.
The session volume profile uses a simplified volume distribution method (volume is evenly distributed across the bar's high-low range in tick-based bins). This is an approximation, not a tick-level volume profile. Accuracy improves on lower timeframes where bars have smaller ranges.
The Overnight VWAP session detection uses an hour-based reset (detecting when the bar's hour enters 17:00 in exchange time) rather than PineScript's built-in session boundary detection. This is intentional: on CME futures, the VWAP session (1700-1600) matches the instrument's native session, which prevents the standard session boundary method from firing correctly.
The deadzone time window relies on your chart's timezone setting. The default of 1100-1300 assumes US Central. Adjust if your chart uses a different timezone.
NOTES
This script is original work, but it stands on the shoulders of giants. The concepts and ideas behind it draw from numerous traders, educators, and open-source contributors who have freely shared their knowledge with the trading community. VWAP, volume profile, session levels, and opening range are not new ideas. What this script attempts to do is bring them together in a thoughtful, configurable way that reflects how an active futures day trader actually uses these tools in practice.
I built this for my own trading first. I am sharing it as open source because the open-source community on Tradingview gave me the foundation to learn, and this is my way of giving back what I have been given.
This is a structural tool, not a trading system. It does not generate buy/sell signals, alerts, or backtest results. Use it as a framework for building your own context around price action.
It's all risky, so you may as well make the bet.
Built and defaulted for CME futures (ES, MES, NQ, MNQ, and similar instruments), but the session times are fully adjustable in settings. Traders on equities, crypto, or forex can adapt the indicator to their instrument by configuring the session windows to match their market's electronic trading hours.
The default session times are set for a trader operating in US Central Time (Chicago time). If you trade in a different timezone, adjust the session inputs accordingly.
This indicator is not a signal generator. It plots structure so you can make your own decisions.
FEATURES
Multiple Anchored VWAPs
The indicator plots two independent session-anchored VWAPs, each with optional standard deviation bands:
Overnight VWAP (VWAP 1) anchors at 17:00 CT (CME session open) and accumulates across the entire futures trading day through 16:00 CT. It resets cleanly each session. Optional 1SD and 2SD bands with fill show the statistical envelope around the developing VWAP.
NY Session VWAP (VWAP 2) anchors at 08:30 CT (Regular Trading Hours open) and accumulates through 16:00 CT. It includes a leapfrog mechanic: when the new RTH session begins, the prior session's VWAP is preserved and continues to plot as "Prev NY VWAP," giving you a reference for how price relates to yesterday's value during overnight trading.
Prev NY VWAP: This is the previous day's NY Session VWAP, which continues accumulating through the overnight session after the NY VWAP resets at 08:30. It provides a critical structural reference, particularly during the premarket and early RTH, showing where the prior session's volume-weighted equilibrium sits relative to current price. Many traders use the relationship between current price, the active NY VWAP, and the Prev NY VWAP to gauge directional bias.
All VWAPs use separate source, color, and line size settings.
Higher Timeframe VWAPs
Optional Weekly and Monthly VWAP overlays provide broader context without cluttering the chart. Disabled by default.
Session Volume Profiles (SVP)
Volume is distributed across the bar's high-low range using a configurable tick-based bin size (default: 2 ticks). The script calculates and plots:
Current Session SVP: POC and Value Area (VAH/VAL) for the active session, updating in real time.
Prior Day SVP: POC and Value Area from the previous completed session. These levels carry forward as horizontal references.
Last Week SVP: POC and Value Area from the prior completed week.
Each profile can be displayed as POC Only or POC + VA. The Value Area percentage is configurable (default: 70%).
Static Reference Levels
Prior Day High/Low (PDH/PDL): Previous day's range boundaries.
Last Week High/Low (LWH/LWL): Previous week's range boundaries.
Previous Session Close (PSC): The prior day's closing price.
Premarket High/Low (PMH/PML): Dynamically tracked during the 18:00-08:30 premarket session.
Opening Range (ORH/ORL): The first 15 minutes of RTH (08:30-08:45), with optional fill.
All static levels are individually togglable with independent color and size controls.
Deadzone
A configurable time window (default: 11:00-13:00 CT) highlighted with a background fill and border lines. This marks the midday period where volume and follow-through typically thin out on equity index futures. The time window is adjustable in settings.
Bar Coloring
Optional bar coloring based on the close's relationship to the three primary VWAPs (Overnight, NY, Prev NY). Bars are colored bullish when above 2 of 3, bearish when below 2 of 3, and neutral otherwise. Disabled by default.
Display Modes
A master display mode toggle lets you switch between:
Advanced All-Level: Shows everything you have enabled, the full suite.
Simplified VWAP: Strips the chart down to just the Overnight VWAP, NY VWAP, Prev NY VWAP, and Opening Range. All volume profiles, static levels, and the deadzone are automatically hidden. Useful for cleaner charts or when you want to focus purely on VWAP structure.
Labels
Every plotted level gets a text label with optional price display, offset to the right of the current bar for readability. Labels can be globally toggled on/off.
HOW TO USE
1. Add the indicator to your chart on an intraday timeframe (1m-30m recommended). It is defaulted for CME futures but can be adapted to any instrument by adjusting the session time inputs.
2. The default session times are built for US Central Time (Chicago). If your chart uses a different timezone, adjust the session inputs in the settings to match your market's session boundaries.
3. The default configuration shows most levels. Start by reviewing what each level represents, then toggle off anything that creates noise for your specific approach.
4. For cleaner charts, switch to "Simplified VWAP" mode, which isolates the core VWAP structure and Opening Range only.
CONFIGURATION
All session times, colors, line sizes, and visibility toggles are individually configurable. The settings are organized into numbered groups for clarity:
1. Master Display Mode
2. Session Times
3. NY VWAP Settings
4. Overnight VWAP Settings
5. Opening Range
6. Volume Profiles (SVP)
7. Static Levels
8. Higher Timeframe VWAPs
9. Deadzone
10. Bar Coloring
11. Labels
LIMITATIONS
The default session times are configured for CME futures with the standard 17:00-16:00 CT (close enough) session structure. If you are using this on equities, crypto, forex, or other instruments, you will need to adjust the session time inputs to match your market's electronic trading hours. The indicator will work on any instrument, but the session boundaries must be set correctly for accurate VWAP anchoring and level calculation.
This is a feature-rich script with multiple VWAPs, volume profiles, and level calculations running simultaneously. Tradingview handles it well the vast majority of the time, but on occasion the script may load slowly or display incompletely. If levels appear missing or the indicator looks off, a simple page refresh will typically resolve it.
The session volume profile uses a simplified volume distribution method (volume is evenly distributed across the bar's high-low range in tick-based bins). This is an approximation, not a tick-level volume profile. Accuracy improves on lower timeframes where bars have smaller ranges.
The Overnight VWAP session detection uses an hour-based reset (detecting when the bar's hour enters 17:00 in exchange time) rather than PineScript's built-in session boundary detection. This is intentional: on CME futures, the VWAP session (1700-1600) matches the instrument's native session, which prevents the standard session boundary method from firing correctly.
The deadzone time window relies on your chart's timezone setting. The default of 1100-1300 assumes US Central. Adjust if your chart uses a different timezone.
NOTES
This script is original work, but it stands on the shoulders of giants. The concepts and ideas behind it draw from numerous traders, educators, and open-source contributors who have freely shared their knowledge with the trading community. VWAP, volume profile, session levels, and opening range are not new ideas. What this script attempts to do is bring them together in a thoughtful, configurable way that reflects how an active futures day trader actually uses these tools in practice.
I built this for my own trading first. I am sharing it as open source because the open-source community on Tradingview gave me the foundation to learn, and this is my way of giving back what I have been given.
This is a structural tool, not a trading system. It does not generate buy/sell signals, alerts, or backtest results. Use it as a framework for building your own context around price action.
It's all risky, so you may as well make the bet.
Note di rilascio
Update: Major Performance Optimization (NQ Timeout Fix)Reason for Update: Addressed a critical performance bottleneck that caused the indicator suite to time out or load extremely slowly on high-tick/fast-moving instruments like NQ futures.What Changed:The functionality, logic, and visual output of the suite remain 100% identical. All changes in this version are strictly under-the-hood engine optimizations designed to reduce CPU load and execution time.Technical Details of the Optimization:Volume Profile Engine Overhaul (Arrays to Maps): The previous version used a manual array insertion loop to track price bins for the SVP, creating a heavy $O(N^2)$ computational bottleneck on every single price tick. This was refactored to utilize Pine Script v6 map collections, allowing for $O(1)$ constant-time data insertion. The script now only extracts and sorts the data into arrays when it needs to calculate and draw the Point of Control (POC) and Value Area (VA), drastically reducing processing time.Consolidated Security Calls: The script previously made five separate request.security() calls to fetch higher-timeframe levels. Because each call carries a base execution overhead, these were grouped into tuples, allowing the script to fetch all necessary daily and weekly data in just two optimized calls.Core Math Efficiency: Replaced computationally expensive functions like math.pow() with direct multiplication (x * x) inside the core accumulation loops (specifically for the VWAP Standard Deviation calculations) to shave off unnecessary engine overhead on every bar.If you previously experienced sluggish performance, UI lag, or "script taking too long to execute" errors on lower timeframes, this update should resolve those issues entirely.Note di rilascio
v2 — Overnight VWAP ModeRenamed the "Simplified VWAP" display mode to "Overnight VWAP Mode" and refined what it shows.
When active, this mode isolates the chart to a focused overnight-to-NY-session view:
NY Session VWAP
Prior NY Session VWAP
Overnight VWAP
Prior Day POC, VAH, and VAL
All other levels (Opening Range, Premarket, Prior Day H/L, Last Week H/L, Prior Close, Deadzone, Weekly/Monthly VWAPs, Current Session SVP, Weekly SVP) are hidden automatically while in this mode. The mode forces VAH/VAL visibility on Prior Day SVP regardless of the SVP style toggle.
Switch back to "Advanced All-Level" to restore full functionality — all individual toggles work exactly as before.
No changes to VWAP, SVP, or session calculation logic. Cosmetic and visibility-layer changes only.
Note di rilascio
v3 — Forward Level ExtensionAdded the ability to project static horizontal levels forward into empty chart space, making it easier to see where price is heading relative to key reference levels.
New input group "12. Forward Extension":
Extend Levels Forward — master toggle (default off)
Extend N Bars Forward — projection distance (1–500 bars, default 50)
Levels that extend when enabled:
Prior Day H/L (PDH/PDL)
Prev Session Close (PSC)
Premarket H/L (PMH/PML)
Opening Range H/L (ORH/ORL)
Last Week H/L (LWH/LWL)
Current Session POC/VAH/VAL
Prior Day POC/VAH/VAL
Weekly POC/VAH/VAL
Only the currently active level extends — historical levels stay confined to their original time period, so the chart doesn't get cluttered with overlapping projections from prior days or weeks.
VWAPs (NY, Prev NY, Overnight) and their bands are intentionally not extended since they recompute every bar.
Default is off — existing layouts unaffected. Works in both Advanced All-Level and Overnight VWAP Mode
Script open-source
Nello spirito di TradingView, l'autore di questo script lo ha reso open source, in modo che i trader possano esaminarne e verificarne la funzionalità. Complimenti all'autore! Sebbene sia possibile utilizzarlo gratuitamente, ricordiamo che la ripubblicazione del codice è soggetta al nostro Regolamento.

Declinazione di responsabilità
Le informazioni e le pubblicazioni non sono intese come, e non costituiscono, consulenza o raccomandazioni finanziarie, di investimento, di trading o di altro tipo fornite o approvate da TradingView. Per ulteriori informazioni, consultare i Termini di utilizzo.
Script open-source
Nello spirito di TradingView, l'autore di questo script lo ha reso open source, in modo che i trader possano esaminarne e verificarne la funzionalità. Complimenti all'autore! Sebbene sia possibile utilizzarlo gratuitamente, ricordiamo che la ripubblicazione del codice è soggetta al nostro Regolamento.
Declinazione di responsabilità
Le informazioni e le pubblicazioni non sono intese come, e non costituiscono, consulenza o raccomandazioni finanziarie, di investimento, di trading o di altro tipo fornite o approvate da TradingView. Per ulteriori informazioni, consultare i Termini di utilizzo.