OPEN-SOURCE SCRIPT
Volumetric Regression Heatmap [LuxAlgo]
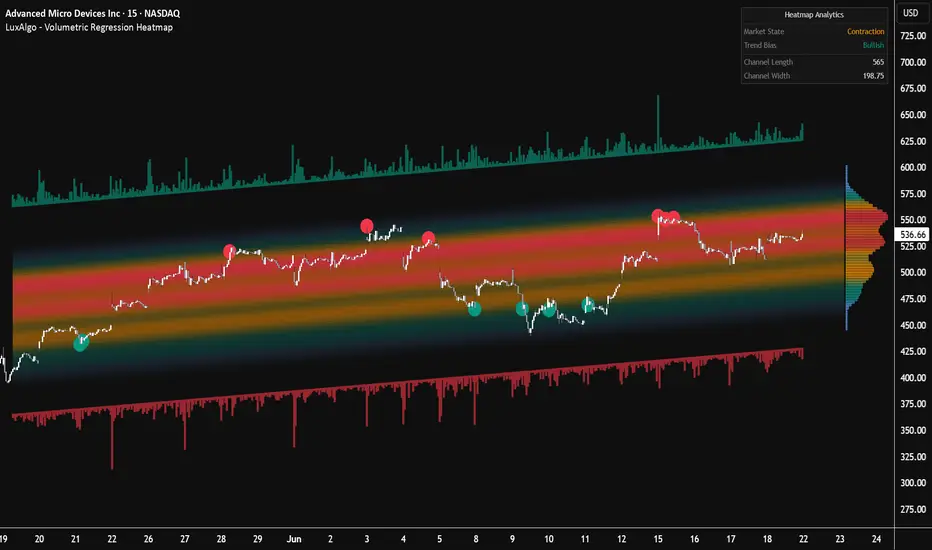
The Volumetric Regression Heatmap indicator is a sophisticated market analysis tool that combines dynamic linear regression with volume profile density to visualize fair value and liquidity zones. By projecting volume-weighted heatmaps within a trend-following channel, it allows traders to identify where the bulk of trading activity has occurred relative to the current price trajectory.
🔶 USAGE
The indicator provides a multi-layered view of market structure. The central heatmap shows the "hottest" areas of volume concentration, acting as a magnet for price, while the outer bands represent statistical extremes.
🔹 Mean Reversion Signals
The script includes a built-in signal system designed for sideways or "flat" markets. When the indicator detects a "Contraction" state (determined by the ratio of channel height to standard deviation), it plots small circles at the +2/-2 standard deviation levels.
🔹 Future Projections & Profile
The heatmap extends beyond the current bar, providing a "Future Projection" zone. This allows traders to anticipate where support and resistance levels will be in the coming sessions. To the right of the projection, a Bookmap-style volume profile histogram displays the total volume distribution, helping to identify high-volume nodes (HVN) and low-volume nodes (LVN) at a glance.
🔶 DETAILS
🔹 Dynamic Auto-Adjusting Period
Unlike standard regression channels that use a fixed lookback, this tool features an adaptive engine. It calculates the ratio between short-term and long-term volatility (ATR).
🔹 Volumetric Delta Histograms
The script calculates the approximate buying and selling volume for every candle within the lookback period. This data is visualized as histograms extending from the outer bands:
This allows traders to see not just where price is, but the intensity of the volume driving it toward the channel extremes.
🔶 SETTINGS
🔹 Core Settings
🔹 Heatmap Settings
🔹 Mean Reversion Signals
🔹 Delta Histograms
🔹 Style & Options
🔹 Dashboard
🔶 USAGE
The indicator provides a multi-layered view of market structure. The central heatmap shows the "hottest" areas of volume concentration, acting as a magnet for price, while the outer bands represent statistical extremes.
🔹 Mean Reversion Signals
The script includes a built-in signal system designed for sideways or "flat" markets. When the indicator detects a "Contraction" state (determined by the ratio of channel height to standard deviation), it plots small circles at the +2/-2 standard deviation levels.
- Green Circles: Potential long opportunities when price crosses below the lower signal band during a flat market.
- Red Circles: Potential short opportunities when price crosses above the upper signal band during a flat market.
🔹 Future Projections & Profile
The heatmap extends beyond the current bar, providing a "Future Projection" zone. This allows traders to anticipate where support and resistance levels will be in the coming sessions. To the right of the projection, a Bookmap-style volume profile histogram displays the total volume distribution, helping to identify high-volume nodes (HVN) and low-volume nodes (LVN) at a glance.
🔶 DETAILS
🔹 Dynamic Auto-Adjusting Period
Unlike standard regression channels that use a fixed lookback, this tool features an adaptive engine. It calculates the ratio between short-term and long-term volatility (ATR).
- In high-volatility environments, the channel period shrinks to become more reactive.
- In low-volatility or ranging environments, the period expands to capture a broader structural view.
🔹 Volumetric Delta Histograms
The script calculates the approximate buying and selling volume for every candle within the lookback period. This data is visualized as histograms extending from the outer bands:
- Top Band (Green): Displays buying pressure delta.
- Bottom Band (Red): Displays selling pressure delta.
This allows traders to see not just where price is, but the intensity of the volume driving it toward the channel extremes.
🔶 SETTINGS
🔹 Core Settings
- Source: The price source used for the regression calculation.
- Base Period: The anchor length for the regression fit.
- Dynamic Auto-Adjusting Period: Enables/disables the volatility-based adaptive lookback.
🔹 Heatmap Settings
- Grid Rows Each Side: Determines the vertical resolution of the heatmap bands.
- Gradient Smoothing: Applies a smoothing algorithm to the volume distribution for a cleaner visual gradient.
- Colors 1-5: Customizable colors ranging from low-volume areas to high-volume "hot" zones.
🔹 Mean Reversion Signals
- Signal Band (SD Multiplier): The standard deviation level required to trigger a signal.
- Flat Slope Threshold: Controls how "flat" the channel must be to allow signals to appear, preventing counter-trend signals in strong trending markets.
🔹 Delta Histograms
- Histogram Height Scale: Adjusts the vertical magnitude of the delta bars.
- Histogram Bar Width: Sets the thickness of the individual delta lines.
🔹 Style & Options
- Future Projection Length: How many bars to project the heatmap into the future.
- Show Volume Profile Histogram: Toggles the right-sided volume distribution boxes.
🔹 Dashboard
- Dashboard: Toggles the on-screen analytics panel.
- Position/Size: Adjusts the location and scale of the dashboard UI.
Script open-source
Nello spirito di TradingView, l'autore di questo script lo ha reso open source, in modo che i trader possano esaminarne e verificarne la funzionalità. Complimenti all'autore! Sebbene sia possibile utilizzarlo gratuitamente, ricordiamo che la ripubblicazione del codice è soggetta al nostro Regolamento.

Build your own edge with AI: luxalgo.com
All content provided by LuxAlgo is for informational & educational purposes only. Past performance does not guarantee future results.
All content provided by LuxAlgo is for informational & educational purposes only. Past performance does not guarantee future results.
Declinazione di responsabilità
Le informazioni e le pubblicazioni non sono intese come, e non costituiscono, consulenza o raccomandazioni finanziarie, di investimento, di trading o di altro tipo fornite o approvate da TradingView. Per ulteriori informazioni, consultare i Termini di utilizzo.
Script open-source
Nello spirito di TradingView, l'autore di questo script lo ha reso open source, in modo che i trader possano esaminarne e verificarne la funzionalità. Complimenti all'autore! Sebbene sia possibile utilizzarlo gratuitamente, ricordiamo che la ripubblicazione del codice è soggetta al nostro Regolamento.
Build your own edge with AI: luxalgo.com
All content provided by LuxAlgo is for informational & educational purposes only. Past performance does not guarantee future results.
All content provided by LuxAlgo is for informational & educational purposes only. Past performance does not guarantee future results.
Declinazione di responsabilità
Le informazioni e le pubblicazioni non sono intese come, e non costituiscono, consulenza o raccomandazioni finanziarie, di investimento, di trading o di altro tipo fornite o approvate da TradingView. Per ulteriori informazioni, consultare i Termini di utilizzo.