OPEN-SOURCE SCRIPT
Stock Market Correlation Heatmap PRO
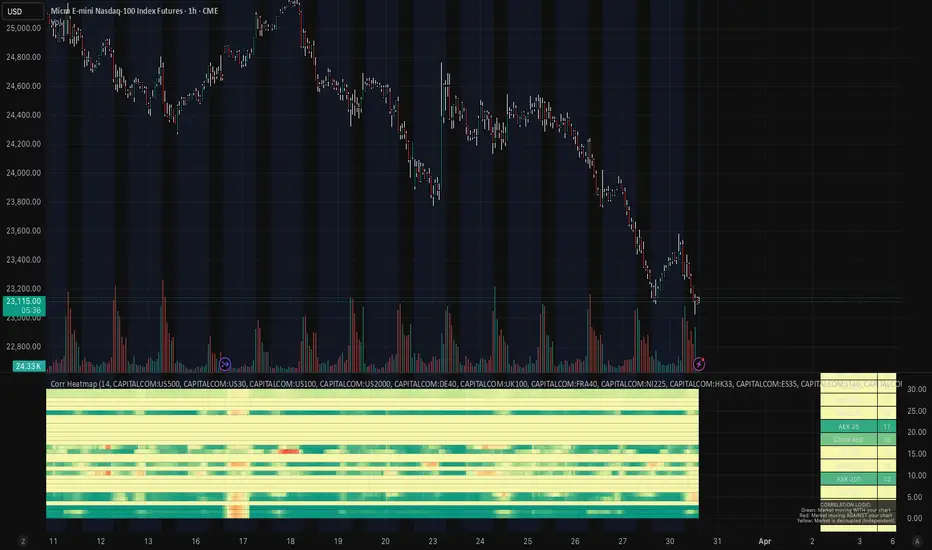
Stock Market Correlation Heatmap PRO
This script is designed to provide a real-time view of how global equity markets are moving relative to the current chart, using correlation as the primary metric.
Instead of focusing on a single instrument in isolation, it offers a broader perspective by tracking multiple indices simultaneously and visualizing their relationship through a structured heatmap.
Core Concept
Markets rarely move independently.
Major indices across the world are often highly correlated during risk-on or risk-off environments, and understanding these relationships can provide additional context for trade decisions.
This script calculates rolling correlation values between the current chart and a basket of global indices, then translates those values into a visual heatmap.
Correlation Logic
Correlation measures how closely two instruments move together:
• +1.0 → Strong positive correlation (moving together)
• 0.0 → No meaningful relationship
• -1.0 → Strong negative correlation (moving opposite)
By continuously recalculating these values over a configurable lookback period, the script provides a dynamic view of market alignment.
Global Market Coverage
The heatmap includes a wide range of global indices, including:
• US markets (S&P 500, NASDAQ, Dow, Russell)
• European markets (DAX, FTSE, CAC, Euro Stoxx)
• Asian markets (Nikkei, Hang Seng, KOSPI, China A50)
• Emerging and regional indices
This allows users to quickly assess whether moves are localized or part of a broader global trend.
Spectral Heatmap Visualization
Correlation values are mapped to a multi-step color gradient for clarity:
• Dark Green → Strong positive correlation
• Light Green → Moderate alignment
• Yellow → Neutral / decoupled
• Orange → Weak inverse correlation
• Red → Strong negative correlation
This “spectral” approach allows for quick interpretation without needing to read raw numbers.
Market Tide (Average Correlation)
The script calculates an aggregate correlation value across all tracked indices, referred to as the “Market Tide.”
This represents overall global alignment with the current chart and can be used to identify:
• Broad market consensus
• Divergence between the chart and global flows
• Strength or weakness of a move relative to the wider market
Use Cases
This tool can be used for:
• Confirming trade direction with global market alignment
• Identifying divergence (when your chart moves independently)
• Avoiding trades during low correlation / mixed conditions
• Understanding risk-on vs risk-off environments
It is particularly useful for indices, futures, and macro-driven markets.
Interpretation Guide
• Strong Green Across Board → Broad market agreement (trend confirmation)
• Mixed Colors → Fragmented market (lower conviction environment)
• Red Across Board → Inverse positioning (potential hedge or divergence)
• Yellow / Neutral → Lack of clear global direction
Customization
• Adjustable correlation lookback period
• Fully customizable symbol list
• Editable color palette for visual preference
Notes
This script is intended as a contextual tool to support decision-making.
It does not generate direct buy or sell signals and should be used alongside price action, structure, and risk management.
This script is designed to provide a real-time view of how global equity markets are moving relative to the current chart, using correlation as the primary metric.
Instead of focusing on a single instrument in isolation, it offers a broader perspective by tracking multiple indices simultaneously and visualizing their relationship through a structured heatmap.
Core Concept
Markets rarely move independently.
Major indices across the world are often highly correlated during risk-on or risk-off environments, and understanding these relationships can provide additional context for trade decisions.
This script calculates rolling correlation values between the current chart and a basket of global indices, then translates those values into a visual heatmap.
Correlation Logic
Correlation measures how closely two instruments move together:
• +1.0 → Strong positive correlation (moving together)
• 0.0 → No meaningful relationship
• -1.0 → Strong negative correlation (moving opposite)
By continuously recalculating these values over a configurable lookback period, the script provides a dynamic view of market alignment.
Global Market Coverage
The heatmap includes a wide range of global indices, including:
• US markets (S&P 500, NASDAQ, Dow, Russell)
• European markets (DAX, FTSE, CAC, Euro Stoxx)
• Asian markets (Nikkei, Hang Seng, KOSPI, China A50)
• Emerging and regional indices
This allows users to quickly assess whether moves are localized or part of a broader global trend.
Spectral Heatmap Visualization
Correlation values are mapped to a multi-step color gradient for clarity:
• Dark Green → Strong positive correlation
• Light Green → Moderate alignment
• Yellow → Neutral / decoupled
• Orange → Weak inverse correlation
• Red → Strong negative correlation
This “spectral” approach allows for quick interpretation without needing to read raw numbers.
Market Tide (Average Correlation)
The script calculates an aggregate correlation value across all tracked indices, referred to as the “Market Tide.”
This represents overall global alignment with the current chart and can be used to identify:
• Broad market consensus
• Divergence between the chart and global flows
• Strength or weakness of a move relative to the wider market
Use Cases
This tool can be used for:
• Confirming trade direction with global market alignment
• Identifying divergence (when your chart moves independently)
• Avoiding trades during low correlation / mixed conditions
• Understanding risk-on vs risk-off environments
It is particularly useful for indices, futures, and macro-driven markets.
Interpretation Guide
• Strong Green Across Board → Broad market agreement (trend confirmation)
• Mixed Colors → Fragmented market (lower conviction environment)
• Red Across Board → Inverse positioning (potential hedge or divergence)
• Yellow / Neutral → Lack of clear global direction
Customization
• Adjustable correlation lookback period
• Fully customizable symbol list
• Editable color palette for visual preference
Notes
This script is intended as a contextual tool to support decision-making.
It does not generate direct buy or sell signals and should be used alongside price action, structure, and risk management.
Script open-source
Nello spirito di TradingView, l'autore di questo script lo ha reso open source, in modo che i trader possano esaminarne e verificarne la funzionalità. Complimenti all'autore! Sebbene sia possibile utilizzarlo gratuitamente, ricordiamo che la ripubblicazione del codice è soggetta al nostro Regolamento.

Declinazione di responsabilità
Le informazioni e le pubblicazioni non sono intese come, e non costituiscono, consulenza o raccomandazioni finanziarie, di investimento, di trading o di altro tipo fornite o approvate da TradingView. Per ulteriori informazioni, consultare i Termini di utilizzo.
Script open-source
Nello spirito di TradingView, l'autore di questo script lo ha reso open source, in modo che i trader possano esaminarne e verificarne la funzionalità. Complimenti all'autore! Sebbene sia possibile utilizzarlo gratuitamente, ricordiamo che la ripubblicazione del codice è soggetta al nostro Regolamento.
Declinazione di responsabilità
Le informazioni e le pubblicazioni non sono intese come, e non costituiscono, consulenza o raccomandazioni finanziarie, di investimento, di trading o di altro tipo fornite o approvate da TradingView. Per ulteriori informazioni, consultare i Termini di utilizzo.