OPEN-SOURCE SCRIPT
Regime-Filtered RSI Value Zones
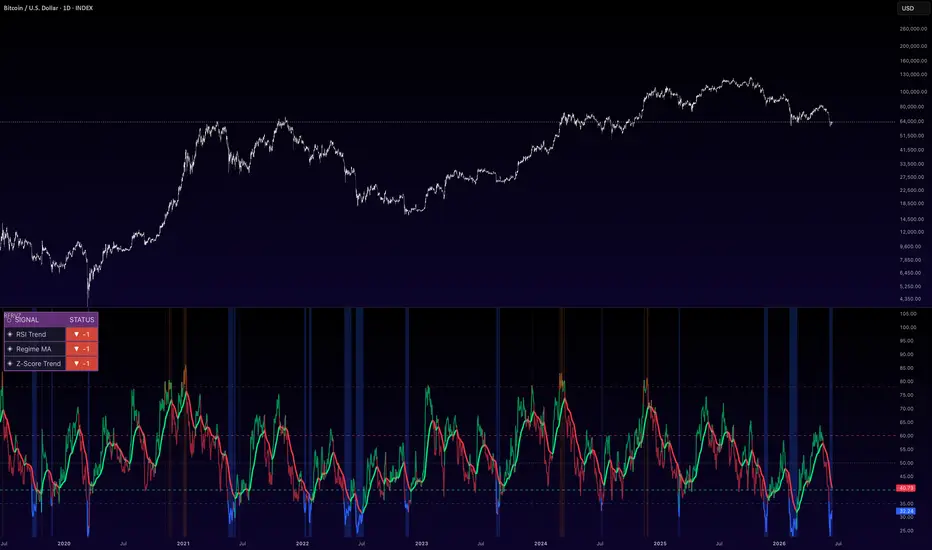
Regime-Filtered RSI Value Zones (RFRVZ)
// A three-layer RSI system combining regime detection, momentum direction
// and Z-score confirmation to identify dynamic DCA buy and sell value zones.
A three-layer RSI-based indicator designed to identify high-probability DCA accumulation and distribution zones on any asset.
How it works:
Layer 1 — RSI Momentum Direction
A user-selectable Moving Average is applied directly to the RSI to identify the current momentum direction. Eight MA types are available including SMA, EMA, HMA, DEMA and TEMA giving full flexibility to tune sensitivity. The MA line plots green when RSI is above it and red when below — providing instant momentum bias at a glance.
Layer 2 — RSI Z-Score
The RSI is normalised against its own recent historical distribution using a Z-Score. This identifies whether current RSI momentum is statistically above or below its recent mean — filtering out weak or noise-driven signals and confirming only statistically meaningful momentum moves.
Layer 3 — DCA Value Zones
Two user-defined RSI threshold levels define the Buy Zone and Sell Zone. When RSI drops into the Buy Zone the panel highlights blue and a single DCA In label fires on entry. When RSI reaches the Sell Zone the panel highlights brown and a DCA Out label fires. Labels are state-managed — one label per zone visit, no repeats until RSI exits and re-enters the zone.
Features:
8 selectable MA types for the RSI smoothing layer
Fully adjustable Buy and Sell Zone thresholds
Adjustable Overbought and Oversold reference levels
Optional Z-Score plot rescaled to RSI scale for direct visual comparison
Toggle for DCA In / Out labels
Clean panel background zone highlighting
// A three-layer RSI system combining regime detection, momentum direction
// and Z-score confirmation to identify dynamic DCA buy and sell value zones.
A three-layer RSI-based indicator designed to identify high-probability DCA accumulation and distribution zones on any asset.
How it works:
Layer 1 — RSI Momentum Direction
A user-selectable Moving Average is applied directly to the RSI to identify the current momentum direction. Eight MA types are available including SMA, EMA, HMA, DEMA and TEMA giving full flexibility to tune sensitivity. The MA line plots green when RSI is above it and red when below — providing instant momentum bias at a glance.
Layer 2 — RSI Z-Score
The RSI is normalised against its own recent historical distribution using a Z-Score. This identifies whether current RSI momentum is statistically above or below its recent mean — filtering out weak or noise-driven signals and confirming only statistically meaningful momentum moves.
Layer 3 — DCA Value Zones
Two user-defined RSI threshold levels define the Buy Zone and Sell Zone. When RSI drops into the Buy Zone the panel highlights blue and a single DCA In label fires on entry. When RSI reaches the Sell Zone the panel highlights brown and a DCA Out label fires. Labels are state-managed — one label per zone visit, no repeats until RSI exits and re-enters the zone.
Features:
8 selectable MA types for the RSI smoothing layer
Fully adjustable Buy and Sell Zone thresholds
Adjustable Overbought and Oversold reference levels
Optional Z-Score plot rescaled to RSI scale for direct visual comparison
Toggle for DCA In / Out labels
Clean panel background zone highlighting
Script open-source
Nello spirito di TradingView, l'autore di questo script lo ha reso open source, in modo che i trader possano esaminarne e verificarne la funzionalità. Complimenti all'autore! Sebbene sia possibile utilizzarlo gratuitamente, ricordiamo che la ripubblicazione del codice è soggetta al nostro Regolamento.

Declinazione di responsabilità
Le informazioni e le pubblicazioni non sono intese come, e non costituiscono, consulenza o raccomandazioni finanziarie, di investimento, di trading o di altro tipo fornite o approvate da TradingView. Per ulteriori informazioni, consultare i Termini di utilizzo.
Script open-source
Nello spirito di TradingView, l'autore di questo script lo ha reso open source, in modo che i trader possano esaminarne e verificarne la funzionalità. Complimenti all'autore! Sebbene sia possibile utilizzarlo gratuitamente, ricordiamo che la ripubblicazione del codice è soggetta al nostro Regolamento.
Declinazione di responsabilità
Le informazioni e le pubblicazioni non sono intese come, e non costituiscono, consulenza o raccomandazioni finanziarie, di investimento, di trading o di altro tipo fornite o approvate da TradingView. Per ulteriori informazioni, consultare i Termini di utilizzo.