OPEN-SOURCE SCRIPT
Aggiornato NYSE Open 30s Range
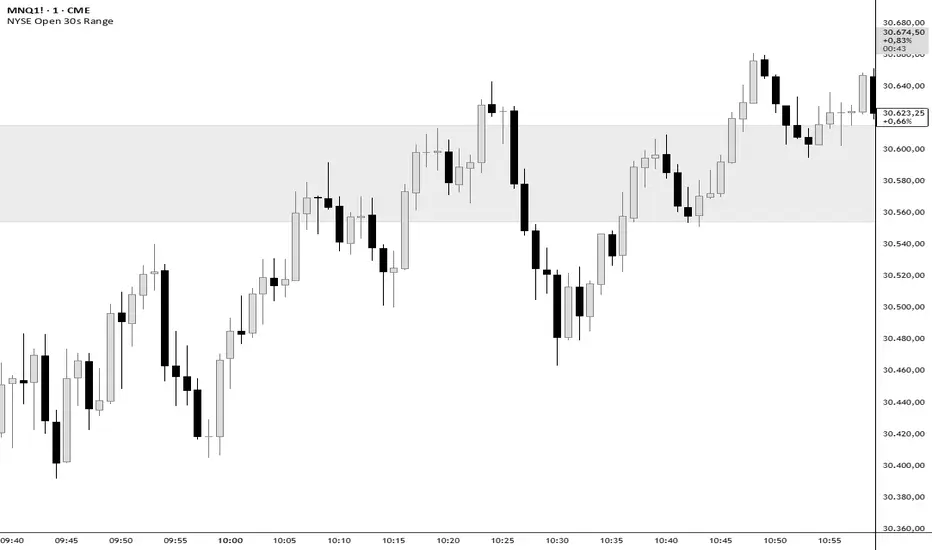
NYSE Opening Range (First 30s Candle)
This indicator automatically plots the NYSE Opening Range based exclusively on the first 30-second candle after the official market open (09:30:00 → 09:30:30 New York time).
The rectangle is drawn using the actual High and Low of that 30-second candle, remaining anchored to the correct opening timestamp regardless of the chart timeframe.
Features
✓ Automatically captures the first 30-second candle of the NYSE open
✓ Rectangle anchored to the actual opening time (does not shift when changing timeframes)
✓ Custom fill color
✓ Adjustable transparency
✓ Custom border color
✓ Multiple border styles (solid, dashed, dotted)
✓ Adjustable border thickness
✓ Adjustable horizontal extension of the range
How to Use
Wait for the first 30-second opening candle to form.
Use the range as a reference for:
Opening breakout setups
Opening rejection setups
Initial market liquidity
Intraday continuation or reversal scenarios
Notes:
The indicator uses internal 30-second data, allowing it to work even on higher chart timeframes.
Time is fixed to America/New_York to maintain alignment with the official NYSE opening session.
This indicator automatically plots the NYSE Opening Range based exclusively on the first 30-second candle after the official market open (09:30:00 → 09:30:30 New York time).
The rectangle is drawn using the actual High and Low of that 30-second candle, remaining anchored to the correct opening timestamp regardless of the chart timeframe.
Features
✓ Automatically captures the first 30-second candle of the NYSE open
✓ Rectangle anchored to the actual opening time (does not shift when changing timeframes)
✓ Custom fill color
✓ Adjustable transparency
✓ Custom border color
✓ Multiple border styles (solid, dashed, dotted)
✓ Adjustable border thickness
✓ Adjustable horizontal extension of the range
How to Use
Wait for the first 30-second opening candle to form.
Use the range as a reference for:
Opening breakout setups
Opening rejection setups
Initial market liquidity
Intraday continuation or reversal scenarios
Notes:
The indicator uses internal 30-second data, allowing it to work even on higher chart timeframes.
Time is fixed to America/New_York to maintain alignment with the official NYSE opening session.
Note di rilascio
Indicator updated to english.Script open-source
Nello spirito di TradingView, l'autore di questo script lo ha reso open source, in modo che i trader possano esaminarne e verificarne la funzionalità. Complimenti all'autore! Sebbene sia possibile utilizzarlo gratuitamente, ricordiamo che la ripubblicazione del codice è soggetta al nostro Regolamento.

Declinazione di responsabilità
Le informazioni e le pubblicazioni non sono intese come, e non costituiscono, consulenza o raccomandazioni finanziarie, di investimento, di trading o di altro tipo fornite o approvate da TradingView. Per ulteriori informazioni, consultare i Termini di utilizzo.
Script open-source
Nello spirito di TradingView, l'autore di questo script lo ha reso open source, in modo che i trader possano esaminarne e verificarne la funzionalità. Complimenti all'autore! Sebbene sia possibile utilizzarlo gratuitamente, ricordiamo che la ripubblicazione del codice è soggetta al nostro Regolamento.
Declinazione di responsabilità
Le informazioni e le pubblicazioni non sono intese come, e non costituiscono, consulenza o raccomandazioni finanziarie, di investimento, di trading o di altro tipo fornite o approvate da TradingView. Per ulteriori informazioni, consultare i Termini di utilizzo.