Sector ETF Intraday Tracker WW
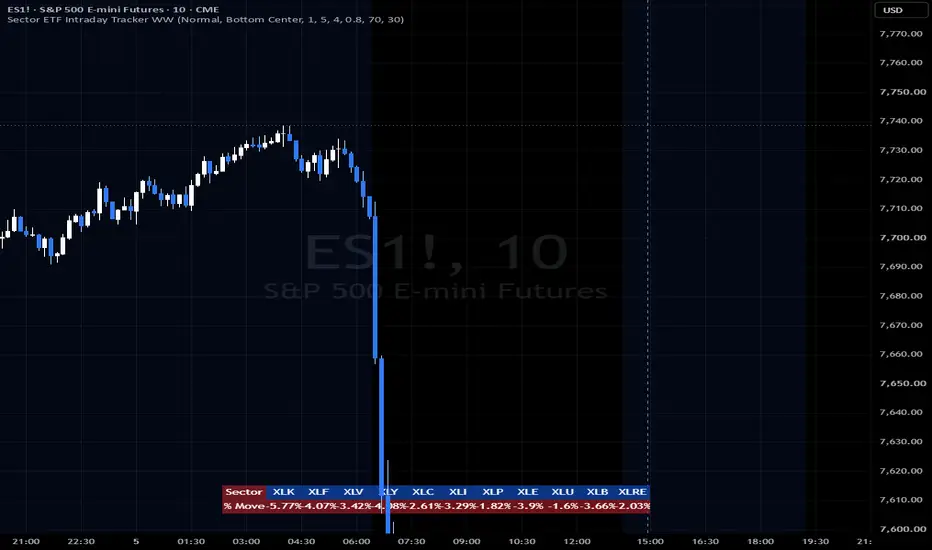
**Sector ETF Intraday Tracker (v6) — Dynamic ATR Layout**
Tracking intraday sector rotation shouldn't mean sacrificing chart real estate or dealing with distracting, jittery visuals. The Sector ETF Intraday Tracker is a console-grade heads-up display designed to instantly visualize market expansion, contraction, and rotation across all 11 S&P 500 sectors, built entirely on Pine Script v6 native tables.
This tracker was engineered with a strict focus on visual stability and eliminating market noise. Rather than just blinking green and red, it dynamically adjusts color intensity based on each sector's Average True Range (ATR), fading out the chop and highlighting genuine moves.
**Key Features:**
* **ATR-Driven Color Saturation:** Not all moves are created equal. The tracker calculates the intraday % change from the daily open against a user-defined fraction of the 14-day ATR. Minor drift gets faded to a subdued transparency, while moves breaking the ATR threshold pop with fully saturated intensity.
* **Locked-In Geometries:** No more horizontal "wobbling" as decimal places fluctuate. The table utilizes rigid, explicit column widths (configurable in settings) to ensure the layout remains totally static and easy to scan at a glance.
* **Smart Tooltips:** Hover over any sector ticker or data cell to view the ETF's full fund name and its current percentage weighting within the S&P 500.
* **Anti-Blowout Capping:** LCD screens tend to wash out white text over highly saturated bright greens and reds. This script includes a "Max Intensity Transparency" cap, ensuring that even at full saturation, the background colors never blow out the data text.
* **Precision Placement:** Floating the dashboard exactly where you want it is simple. The script includes a custom "Vertical Offset" row spacer, allowing you to nudge the table cleanly away from the absolute top or bottom margins of your chart window so it never overlaps your time or price axes.
**Customization & Settings:**
The configuration panel is fully broken out for complete control over the layout and aesthetic.
* **Layout & Positioning:** Set your docking anchor (e.g., Bottom Center, Top Right), adjust the text size, and dial in your vertical offset rows to float the table perfectly.
* **Thresholds & Dimensions:** Widen or narrow the header and data columns to fit your screen resolution. Adjust the *ATR Sensitivity Factor* (default 0.8) to dictate exactly when a sector receives full color intensity.
* **Colors & Contrast:** Dial in your exact hex codes for Bullish, Bearish, and Header backgrounds. *(Note for fellow scripters: The transparency math under the hood has been inverted so that the TradingView UI "Opacity" sliders behave exactly as expected, reading 10% to 100% naturally without overriding the dynamic ATR shading).*
**Sectors Tracked:** XLK (Tech), XLF (Financials), XLV (Health Care), XLY (Consumer Discretionary), XLC (Communication Services), XLI (Industrials), XLP (Consumer Staples), XLE (Energy), XLU (Utilities), XLB (Materials), XLRE (Real Estate).
Drop it on a lower timeframe chart, set your anchor, and let the dashboard handle the rest.
Tracking intraday sector rotation shouldn't mean sacrificing chart real estate or dealing with distracting, jittery visuals. The Sector ETF Intraday Tracker is a console-grade heads-up display designed to instantly visualize market expansion, contraction, and rotation across all 11 S&P 500 sectors, built entirely on Pine Script v6 native tables.
This tracker was engineered with a strict focus on visual stability and eliminating market noise. Rather than just blinking green and red, it dynamically adjusts color intensity based on each sector's Average True Range (ATR), fading out the chop and highlighting genuine moves.
**Key Features:**
* **ATR-Driven Color Saturation:** Not all moves are created equal. The tracker calculates the intraday % change from the daily open against a user-defined fraction of the 14-day ATR. Minor drift gets faded to a subdued transparency, while moves breaking the ATR threshold pop with fully saturated intensity.
* **Locked-In Geometries:** No more horizontal "wobbling" as decimal places fluctuate. The table utilizes rigid, explicit column widths (configurable in settings) to ensure the layout remains totally static and easy to scan at a glance.
* **Smart Tooltips:** Hover over any sector ticker or data cell to view the ETF's full fund name and its current percentage weighting within the S&P 500.
* **Anti-Blowout Capping:** LCD screens tend to wash out white text over highly saturated bright greens and reds. This script includes a "Max Intensity Transparency" cap, ensuring that even at full saturation, the background colors never blow out the data text.
* **Precision Placement:** Floating the dashboard exactly where you want it is simple. The script includes a custom "Vertical Offset" row spacer, allowing you to nudge the table cleanly away from the absolute top or bottom margins of your chart window so it never overlaps your time or price axes.
**Customization & Settings:**
The configuration panel is fully broken out for complete control over the layout and aesthetic.
* **Layout & Positioning:** Set your docking anchor (e.g., Bottom Center, Top Right), adjust the text size, and dial in your vertical offset rows to float the table perfectly.
* **Thresholds & Dimensions:** Widen or narrow the header and data columns to fit your screen resolution. Adjust the *ATR Sensitivity Factor* (default 0.8) to dictate exactly when a sector receives full color intensity.
* **Colors & Contrast:** Dial in your exact hex codes for Bullish, Bearish, and Header backgrounds. *(Note for fellow scripters: The transparency math under the hood has been inverted so that the TradingView UI "Opacity" sliders behave exactly as expected, reading 10% to 100% naturally without overriding the dynamic ATR shading).*
**Sectors Tracked:** XLK (Tech), XLF (Financials), XLV (Health Care), XLY (Consumer Discretionary), XLC (Communication Services), XLI (Industrials), XLP (Consumer Staples), XLE (Energy), XLU (Utilities), XLB (Materials), XLRE (Real Estate).
Drop it on a lower timeframe chart, set your anchor, and let the dashboard handle the rest.

Declinazione di responsabilità
Le informazioni e le pubblicazioni non sono intese come, e non costituiscono, consulenza o raccomandazioni finanziarie, di investimento, di trading o di altro tipo fornite o approvate da TradingView. Per ulteriori informazioni, consultare i Termini di utilizzo.
Declinazione di responsabilità
Le informazioni e le pubblicazioni non sono intese come, e non costituiscono, consulenza o raccomandazioni finanziarie, di investimento, di trading o di altro tipo fornite o approvate da TradingView. Per ulteriori informazioni, consultare i Termini di utilizzo.