Log Regression Channel v2
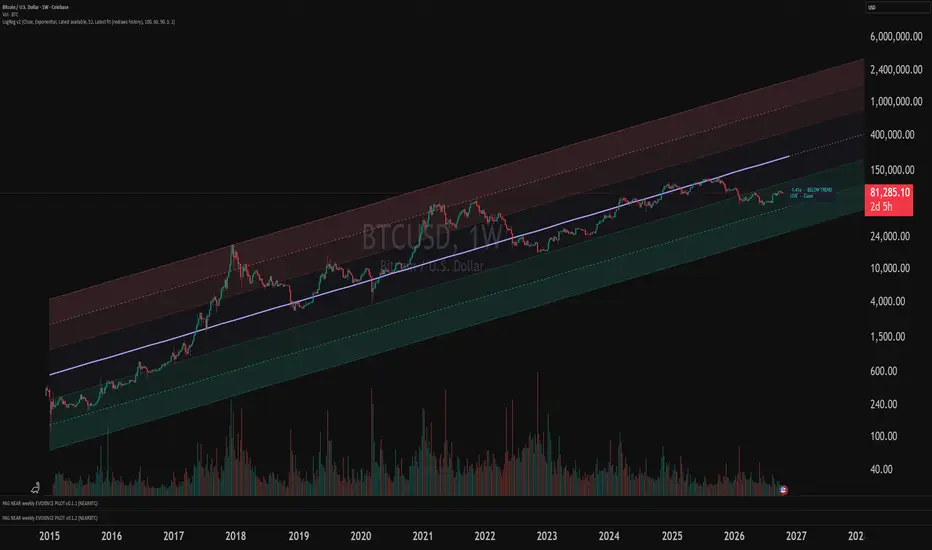
Log Regression Channel v2 plots a long-term fitted price trend with bands showing how far price sits above or below that trend. It uses regression on the natural logarithm of price, so deviations are measured proportionally rather than in fixed dollar amounts.
This is an adaptation of “Log-Regression Channels RV” by manuschm1988:
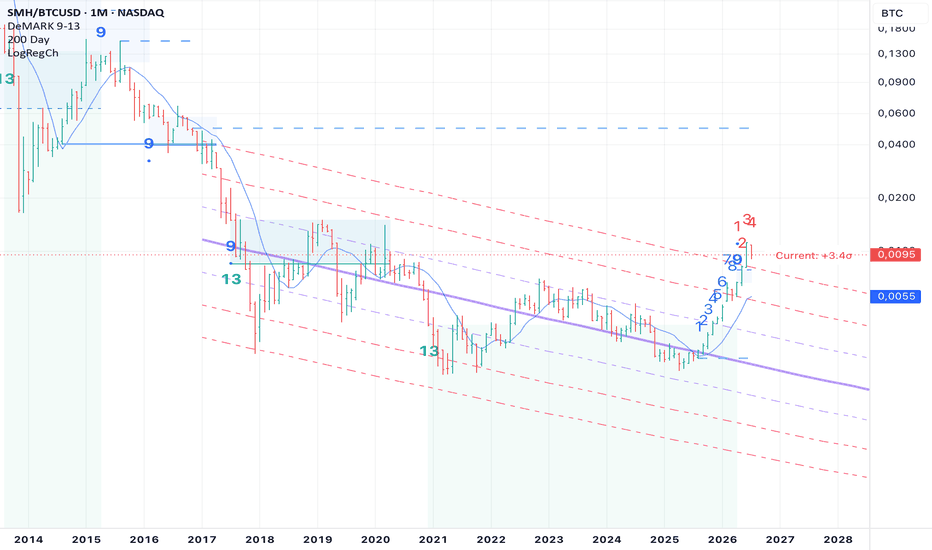
This version adds calendar-time calculations, an optional power-law model, confirmed-bar fitting, an “As known then” historical view, start-date sensitivity checks, prior-fit forecast diagnostics, and updated visuals.
READING THE CHANNEL
• Purple: fitted trend.
• Teal: below-trend bands.
• Rose: above-trend bands.
• Bands: ±1, ±2 and ±3 residual standard deviations in log-price space.
• Current badge: the selected price source’s deviation from the fitted trend, marked LIVE or CONFIRMED.
For example, −1.40σ means the selected price source is 1.4 residual standard deviations below the fitted log-price trend under the current settings. It does not mean price is 1.4 standard deviations below its arithmetic average, nor does it establish a probability of a rebound.
The trend and bands are converted back into price units for display. Bands are multiplicative, so their dollar distances above and below the trend are unequal.
GETTING STARTED
1. For an initial BTC setup, use standard weekly candles and a logarithmic price scale. The scale changes the presentation, not the calculation.
2. Start with the defaults: Close, Exponential, a January 2015 regression start, and Latest available end.
3. Leave “Include unfinished bar in fit” off to fit confirmed bars only. The live badge still updates as the current price changes.
4. Choose the channel view appropriate to your analysis.
5. Enable “Show diagnostics” when you want to inspect the sample, compare models, or check sensitivity to the starting date. Diagnostics are off by default.
The default minimum is 52 valid observations. The indicator needs sufficient loaded chart history; selecting an earlier start date cannot supply data that the chart does not contain.
MODEL OPTIONS
• Exponential fits log price against elapsed calendar time, representing a constant fitted percentage growth or decline rate.
• Power law fits log price against the logarithm of days since a chosen origin. With a positive exponent, its percentage growth rate slows as the asset ages. The default origin is Bitcoin’s genesis date, January 3, 2009. For other assets, choose an appropriate origin before the fitting period.
Neither model is automatically more accurate. Results depend on the symbol, timeframe, price source, dates and model assumptions.
HISTORICAL VIEWS AND UPDATES
“Latest fit (redraws history)” applies the most recent fit across the channel’s history. Earlier channel levels change as new observations enter the sample. This is a view of today’s fitted relationship, not a record of signals available in real time.
“As known then (confirmed bars)” displays the fit available at each historical bar’s close, including that bar. Later bars do not enter those earlier fits. Changing settings or the underlying dataset will recalculate the history. This view does not plot the unfinished bar.
“Latest available” extends the fitting sample as new eligible bars arrive. “Fixed date” stops adding observations after the selected endpoint and evaluates the frozen model beyond it. Dates select bars by their opening timestamps; a weekly or monthly bar may close after the chosen endpoint.
OPTIONAL DIAGNOSTICS
The panel shows actual fitting dates, sample size, current deviation, residual dispersion, log-space R² and model-implied next-year growth.
The 2015, 2017 and 2021 comparisons show how much the current reading changes with different starting dates. They do not automatically select an optimal start.
Prior-fit log RMSE compares exponential and power-law errors on the same confirmed observations, using fits calculated before each evaluated bar. Lower values mean smaller errors over that evaluated sample. After a fixed endpoint, these become forecasts from the frozen model at increasing horizons. This comparison is not a trading backtest.
LIMITATIONS
The bands describe historical residual dispersion. They are not calibrated probability intervals, fair-value estimates or standalone buy/sell signals. Price can remain far from the fitted trend, and a high R² does not establish forecasting ability.
Forward extensions continue the fitted relationship; they are not price targets. They are available only in Latest-fit view, and future bar spacing is approximate.
Use the channel as context alongside other analysis, with consistent settings when comparing readings.
This is an adaptation of “Log-Regression Channels RV” by manuschm1988:
This version adds calendar-time calculations, an optional power-law model, confirmed-bar fitting, an “As known then” historical view, start-date sensitivity checks, prior-fit forecast diagnostics, and updated visuals.
READING THE CHANNEL
• Purple: fitted trend.
• Teal: below-trend bands.
• Rose: above-trend bands.
• Bands: ±1, ±2 and ±3 residual standard deviations in log-price space.
• Current badge: the selected price source’s deviation from the fitted trend, marked LIVE or CONFIRMED.
For example, −1.40σ means the selected price source is 1.4 residual standard deviations below the fitted log-price trend under the current settings. It does not mean price is 1.4 standard deviations below its arithmetic average, nor does it establish a probability of a rebound.
The trend and bands are converted back into price units for display. Bands are multiplicative, so their dollar distances above and below the trend are unequal.
GETTING STARTED
1. For an initial BTC setup, use standard weekly candles and a logarithmic price scale. The scale changes the presentation, not the calculation.
2. Start with the defaults: Close, Exponential, a January 2015 regression start, and Latest available end.
3. Leave “Include unfinished bar in fit” off to fit confirmed bars only. The live badge still updates as the current price changes.
4. Choose the channel view appropriate to your analysis.
5. Enable “Show diagnostics” when you want to inspect the sample, compare models, or check sensitivity to the starting date. Diagnostics are off by default.
The default minimum is 52 valid observations. The indicator needs sufficient loaded chart history; selecting an earlier start date cannot supply data that the chart does not contain.
MODEL OPTIONS
• Exponential fits log price against elapsed calendar time, representing a constant fitted percentage growth or decline rate.
• Power law fits log price against the logarithm of days since a chosen origin. With a positive exponent, its percentage growth rate slows as the asset ages. The default origin is Bitcoin’s genesis date, January 3, 2009. For other assets, choose an appropriate origin before the fitting period.
Neither model is automatically more accurate. Results depend on the symbol, timeframe, price source, dates and model assumptions.
HISTORICAL VIEWS AND UPDATES
“Latest fit (redraws history)” applies the most recent fit across the channel’s history. Earlier channel levels change as new observations enter the sample. This is a view of today’s fitted relationship, not a record of signals available in real time.
“As known then (confirmed bars)” displays the fit available at each historical bar’s close, including that bar. Later bars do not enter those earlier fits. Changing settings or the underlying dataset will recalculate the history. This view does not plot the unfinished bar.
“Latest available” extends the fitting sample as new eligible bars arrive. “Fixed date” stops adding observations after the selected endpoint and evaluates the frozen model beyond it. Dates select bars by their opening timestamps; a weekly or monthly bar may close after the chosen endpoint.
OPTIONAL DIAGNOSTICS
The panel shows actual fitting dates, sample size, current deviation, residual dispersion, log-space R² and model-implied next-year growth.
The 2015, 2017 and 2021 comparisons show how much the current reading changes with different starting dates. They do not automatically select an optimal start.
Prior-fit log RMSE compares exponential and power-law errors on the same confirmed observations, using fits calculated before each evaluated bar. Lower values mean smaller errors over that evaluated sample. After a fixed endpoint, these become forecasts from the frozen model at increasing horizons. This comparison is not a trading backtest.
LIMITATIONS
The bands describe historical residual dispersion. They are not calibrated probability intervals, fair-value estimates or standalone buy/sell signals. Price can remain far from the fitted trend, and a high R² does not establish forecasting ability.
Forward extensions continue the fitted relationship; they are not price targets. They are available only in Latest-fit view, and future bar spacing is approximate.
Use the channel as context alongside other analysis, with consistent settings when comparing readings.

Declinazione di responsabilità
Le informazioni e le pubblicazioni non sono intese come, e non costituiscono, consulenza o raccomandazioni finanziarie, di investimento, di trading o di altro tipo fornite o approvate da TradingView. Per ulteriori informazioni, consultare i Termini di utilizzo.
Declinazione di responsabilità
Le informazioni e le pubblicazioni non sono intese come, e non costituiscono, consulenza o raccomandazioni finanziarie, di investimento, di trading o di altro tipo fornite o approvate da TradingView. Per ulteriori informazioni, consultare i Termini di utilizzo.