Multi Time Frame EMA 21 / 50 / 200
Title:
Multi Time Frame EMA 21 / 50 / 200
Description:
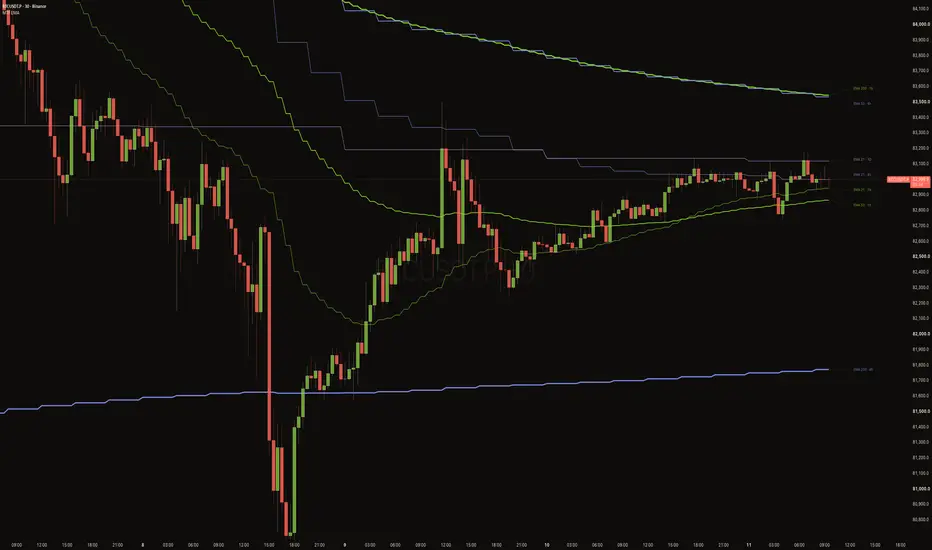
Multi Time Frame EMA 21 / 50 / 200 draws the 21, 50 and 200 EMAs from up to 12 timeframes on one chart, with one indicator. Each line ends in a small note, such as "EMA 200 · 4h", so you can always tell which timeframe and EMA a line belongs to.
HOW IT WORKS
• Timeframes: Chart, 1m, 3m, 5m, 15m, 30m, 1h, 4h, 8h, 1D, 3D and 1W.
• For each timeframe the script calculates the three EMAs on that timeframe's own candles and draws them on your chart.
• All three EMAs of a timeframe come from a single data request. Only enabled timeframes are requested, which keeps the script light.
• Timeframes lower than the chart's are hidden automatically, because they cannot be shown meaningfully on a higher-timeframe chart. A timeframe equal to the chart's uses the chart's own EMAs.
SETTINGS
EMA lengths / line width
• The three EMA lengths (default 21, 50, 200) and a line width for each. The widths are 1, 2 and 3 by default, so the colour tells you the timeframe and the thickness tells you the EMA.
• Source (default: close).
• History (bars): how far back the lines are drawn (default 2000).
• Wait for higher-timeframe bar to close (default on):
– On: a higher-timeframe EMA only updates when that timeframe's candle closes. Historical values are exactly what you would have seen live, so the lines do not repaint.
– Off: the EMA moves live with the still-open higher-timeframe candle. This is more responsive, but past values can look better than they really were.
Timeframe — enabled / EMAs / color
One row per timeframe: an on/off switch, a checkbox for each EMA (21 / 50 / 200), and a colour. For example, you can show only the 200 EMA on the weekly and all three EMAs on the 4h.
By default, Chart, 1h, 4h and 1D are enabled.
Line notes
• A small note to the right of the last visible candle, in the line's colour, with a dotted connector pointing to the exact price.
• Notes close to each other are spaced apart automatically so they stay readable. Note spacing (%) controls the minimum distance.
• Lines at the same price share one note (for example "EMA 50 · Chart · 1h" on a 1h chart).
• Hover a note to see the exact EMA value and whether it uses closed or live higher-timeframe candles.
• Note size and distance from the candles are adjustable, and notes can be turned off.
HOW TO USE IT
Higher-timeframe EMAs often act as support and resistance, and their order shows the trend on each timeframe. With several timeframes on one chart you can see at a glance:
• where price sits relative to the 1h, 4h and daily trend;
• where EMAs from different timeframes cluster, forming stronger zones;
• when a lower-timeframe pullback reaches a higher-timeframe EMA.
Example from the chart above: BTCUSDT on the 30-minute chart, with the 1h EMAs (green), 4h EMAs (blue) and 1D EMA 21 (purple). Price is consolidating between the 1h EMA 21/50 below and the 4h/1D EMA 21 just above, while the 1h EMA 200 and 4h EMA 50 overhead mark the next resistance zone.
NOTES AND LIMITATIONS
• To fit all 36 possible lines (12 timeframes × 3 EMAs) with a colour per timeframe, the lines are drawn as polylines instead of plots. Because of this, the values do not appear in the Data Window or on the price scale. Hover the notes for exact values.
• Lines are drawn for the number of bars set in History (bars).
• Higher-timeframe EMAs need enough history on that timeframe. A 200 EMA on the weekly needs about 200 weeks of data, so it may not appear on recently listed symbols.
• Works on standard time-based charts.
This indicator is a visual tool and not a trading signal or financial advice.
Multi Time Frame EMA 21 / 50 / 200
Description:
Multi Time Frame EMA 21 / 50 / 200 draws the 21, 50 and 200 EMAs from up to 12 timeframes on one chart, with one indicator. Each line ends in a small note, such as "EMA 200 · 4h", so you can always tell which timeframe and EMA a line belongs to.
HOW IT WORKS
• Timeframes: Chart, 1m, 3m, 5m, 15m, 30m, 1h, 4h, 8h, 1D, 3D and 1W.
• For each timeframe the script calculates the three EMAs on that timeframe's own candles and draws them on your chart.
• All three EMAs of a timeframe come from a single data request. Only enabled timeframes are requested, which keeps the script light.
• Timeframes lower than the chart's are hidden automatically, because they cannot be shown meaningfully on a higher-timeframe chart. A timeframe equal to the chart's uses the chart's own EMAs.
SETTINGS
EMA lengths / line width
• The three EMA lengths (default 21, 50, 200) and a line width for each. The widths are 1, 2 and 3 by default, so the colour tells you the timeframe and the thickness tells you the EMA.
• Source (default: close).
• History (bars): how far back the lines are drawn (default 2000).
• Wait for higher-timeframe bar to close (default on):
– On: a higher-timeframe EMA only updates when that timeframe's candle closes. Historical values are exactly what you would have seen live, so the lines do not repaint.
– Off: the EMA moves live with the still-open higher-timeframe candle. This is more responsive, but past values can look better than they really were.
Timeframe — enabled / EMAs / color
One row per timeframe: an on/off switch, a checkbox for each EMA (21 / 50 / 200), and a colour. For example, you can show only the 200 EMA on the weekly and all three EMAs on the 4h.
By default, Chart, 1h, 4h and 1D are enabled.
Line notes
• A small note to the right of the last visible candle, in the line's colour, with a dotted connector pointing to the exact price.
• Notes close to each other are spaced apart automatically so they stay readable. Note spacing (%) controls the minimum distance.
• Lines at the same price share one note (for example "EMA 50 · Chart · 1h" on a 1h chart).
• Hover a note to see the exact EMA value and whether it uses closed or live higher-timeframe candles.
• Note size and distance from the candles are adjustable, and notes can be turned off.
HOW TO USE IT
Higher-timeframe EMAs often act as support and resistance, and their order shows the trend on each timeframe. With several timeframes on one chart you can see at a glance:
• where price sits relative to the 1h, 4h and daily trend;
• where EMAs from different timeframes cluster, forming stronger zones;
• when a lower-timeframe pullback reaches a higher-timeframe EMA.
Example from the chart above: BTCUSDT on the 30-minute chart, with the 1h EMAs (green), 4h EMAs (blue) and 1D EMA 21 (purple). Price is consolidating between the 1h EMA 21/50 below and the 4h/1D EMA 21 just above, while the 1h EMA 200 and 4h EMA 50 overhead mark the next resistance zone.
NOTES AND LIMITATIONS
• To fit all 36 possible lines (12 timeframes × 3 EMAs) with a colour per timeframe, the lines are drawn as polylines instead of plots. Because of this, the values do not appear in the Data Window or on the price scale. Hover the notes for exact values.
• Lines are drawn for the number of bars set in History (bars).
• Higher-timeframe EMAs need enough history on that timeframe. A 200 EMA on the weekly needs about 200 weeks of data, so it may not appear on recently listed symbols.
• Works on standard time-based charts.
This indicator is a visual tool and not a trading signal or financial advice.

Declinazione di responsabilità
Le informazioni e le pubblicazioni non sono intese come, e non costituiscono, consulenza o raccomandazioni finanziarie, di investimento, di trading o di altro tipo fornite o approvate da TradingView. Per ulteriori informazioni, consultare i Termini di utilizzo.
Declinazione di responsabilità
Le informazioni e le pubblicazioni non sono intese come, e non costituiscono, consulenza o raccomandazioni finanziarie, di investimento, di trading o di altro tipo fornite o approvate da TradingView. Per ulteriori informazioni, consultare i Termini di utilizzo.