Helix Lucky MTF Bias and Breakout Dashboard
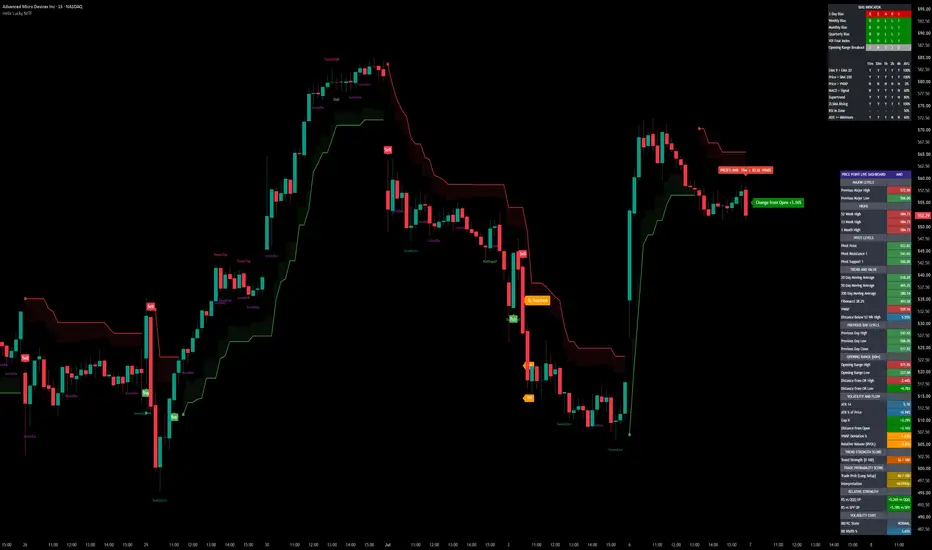
Helix Lucky MTF Trend and Breakout Dashboard
📊 Overview
Helix Lucky MTF Trend and Breakout Dashboard is an overlay indicator designed to organize trend, momentum, breakout context, key levels, and multi-timeframe alignment into one chart-based dashboard.
The purpose of the script is not to combine unrelated indicators into a single display. The script separates market analysis into distinct layers so each component has a specific role:
1. Trend structure
2. Momentum confirmation
3. Breakout context
4. Multi-timeframe alignment
5. Key level awareness
6. Setup scoring
7. Optional visual confirmation tools
The result is a confluence-based workflow that helps traders review whether multiple independent conditions are aligned before making a trading decision.
🧩 How the Main Components Work Together
The script uses moving averages, VWAP, MACD, ZLSMA, UT Bot logic, Supertrend, ADX, RSI, and Opening Range Breakout logic as separate inputs within the same framework.
The moving average group provides basic trend structure by comparing shorter-term and longer-term averages. The default structure uses a fast EMA, medium EMA, and long SMA, but users can configure the moving average types and lengths.
VWAP provides session or higher-period price-location context. It can be anchored to the session, day, week, month, quarter, or year and may be displayed with standard deviation or percentage-based bands.
MACD is used as a momentum confirmation layer. The script includes a minimum separation filter so very small MACD differences can be filtered out instead of being treated the same as stronger momentum shifts.
ZLSMA is optional and can be used as an additional trend-direction filter.
The UT Bot component is used as the primary chart label engine. It uses an ATR-based adaptive trailing stop. The script adjusts the trailing distance using volatility, momentum, and volume conditions, then produces Buy or Sell labels when price crosses the trailing stop and the configured filters allow the signal.
Supertrend provides a separate trend-regime layer. This gives the user a second way to compare the UT Bot label against a broader trend condition.
ADX is used to evaluate whether trend strength is above the user-selected threshold. RSI can be used either in a classic 30/70 bias mode or with custom pullback zones.
The Opening Range Breakout component tracks whether price is above, below, or inside the selected opening range window. This helps separate trend-following conditions from range-bound conditions.
🧠 Why This Is More Than a Simple Mashup
Each component is assigned a different purpose. The script is designed so the same tools are not all treated as equal standalone signals.
Trend tools identify direction.
Momentum tools evaluate confirmation.
Volume and relative volume help evaluate participation.
Opening Range Breakout logic identifies range expansion.
The Bias Table compares selected conditions across multiple timeframes.
The Price Point Dashboard displays important reference levels and live context.
The scoring layer organizes these conditions into a rule-based summary.
This structure allows the script to reduce chart clutter while still showing how the underlying conditions agree or disagree.
🕒 Multi-Timeframe Bias Table
The Multi-Timeframe Bias Table displays up to eight selectable timeframes, including 1 minute, 5 minutes, 15 minutes, 30 minutes, 1 hour, 2 hours, 4 hours, and Daily.
Each row evaluates one condition, such as moving average structure, price relative to VWAP, MACD alignment, Supertrend direction, ZLSMA slope, RSI condition, ADX threshold, Opening Range Breakout status, and longer-period bias.
The table also includes an average agreement reading. This reading is not a prediction and does not represent a win rate. It simply shows how many selected conditions are aligned across the active timeframes.
By default, the script can hide timeframes below the current chart timeframe. This is intended to reduce lower-timeframe noise when viewing higher-timeframe charts.
📍 Price Point Dashboard
The Price Point Dashboard displays reference levels and market context in one location. These can include prior day high, prior day low, prior day close, pivot levels, moving averages, 52-week high, Fibonacci reference levels, VWAP information, Opening Range Breakout status, ATR, gap percentage, relative volume, and other selected dashboard fields.
The dashboard is intended to help users see where price is trading relative to important reference levels without manually adding each level to the chart.
📈 Trend Strength Score
The Trend Strength Score is a rule-based 0 to 100 score that measures how strongly the current bar aligns with selected bullish trend conditions.
The score uses five weighted components:
- EMA alignment
- VWAP location
- MACD alignment
- Supertrend direction
- ADX strength
The score is a summary of internal conditions only. It does not predict future price movement.
🎯 Trade Probability Score
The Trade Probability Score is a rule-based 0 to 100 setup-quality score. It is calculated from twelve weighted factors:
- Multi-timeframe alignment
- EMA stack
- VWAP location
- Price relative to the 200-period moving average
- MACD alignment
- Supertrend direction
- ADX strength
- Relative volume
- Opening Range Breakout status
- Relative strength versus a selected benchmark
- Volatility state
- Position relative to key levels
The score is intended to summarize confluence. A higher score means more of the script’s internal conditions are aligned. It does not mean that a trade will be profitable, and it should not be interpreted as a guaranteed probability of success.
💧 Liquidity Sweep Detection
The script can detect liquidity sweep conditions by checking whether price moves beyond a recent swing high or swing low and then closes back inside that level.
A Sweep High label indicates that price moved above a recent high and then closed back below that level.
A Sweep Low label indicates that price moved below a recent low and then closed back above that level.
These labels are intended to identify possible rejection behavior around recent swing points. They should be used as context, not as standalone trade signals.
⚖️ Relative Strength
The script includes relative strength comparison against configurable benchmark symbols. The default benchmarks are QQQ and SPY.
Relative strength is calculated by comparing the current symbol’s intraday return against the benchmark’s intraday return. A positive value means the current symbol is outperforming the benchmark over that comparison period. A negative value means it is underperforming.
🌡️ Volatility State
The Volatility State feature classifies the current volatility environment as Squeeze, Normal, or Expansion.
This is based on Bollinger Band width compared with Keltner Channel width and recent volatility behavior.
Squeeze indicates compressed volatility.
Normal indicates a standard volatility environment.
Expansion indicates that volatility has increased relative to recent conditions.
This feature is included to help users understand whether price is consolidating, behaving normally, or expanding in volatility.
🕯️ Candlestick Pattern Labels
The script includes optional candlestick pattern labels. These patterns are detected on the same timeframe as the chart. They are not calculated from a separate hidden timeframe.
Optional labels include:
- Bullish Engulfing
- Bearish Engulfing
- Hammer
- Shooting Star
- Morning Star
- Evening Star
- Inside Bar
- Tweezer Top
- Tweezer Bottom
- Doji
- Dragonfly Doji
- Gravestone Doji
- Sweep High
- Sweep Low
These labels are intended as additional context. They should not be treated as standalone entries without reviewing trend, momentum, volatility, and key-level context.
🛑 Suggested Stop Loss and Take Profit Reference Lines
The script can plot suggested stop loss and take profit reference lines after a UT Bot label appears.
The stop line is calculated from internal structure such as the UT Bot stop, Supertrend, VWAP, moving average, Donchian floor, and a minimum ATR-based risk floor depending on settings and context.
Take profit reference lines are based on R-multiple distances from the suggested stop. These are visual planning tools only. They do not place trades, manage positions, or execute orders.
🧭 How to Use the Script
A typical workflow is:
1. Select the chart timeframe and market being reviewed.
2. Review the Multi-Timeframe Bias Table to understand directional alignment.
3. Check whether the chart is trending, ranging, breaking out, or consolidating.
4. Review the Price Point Dashboard for key levels and market context.
5. Watch for a UT Bot Buy or Sell label if labels are enabled.
6. Compare the label direction with Supertrend, MACD, VWAP, ADX, and the Bias Table.
7. Review the Trend Strength Score and Trade Probability Score as confluence summaries.
8. Use the suggested stop and take profit reference lines only as visual planning tools.
9. Apply independent risk management and confirm the setup with your own analysis.
🌍 Timeframes and Markets
The script can be applied to different chart timeframes and TradingView-supported markets. Lower timeframes may produce more signals and more noise. Higher timeframes may produce fewer signals but can provide broader context.
The Multi-Timeframe Bias Table is intended to help users avoid looking at a single timeframe in isolation.
⚠️ Important Limitations
This script is an indicator, not a strategy. It does not place trades, backtest trades, manage orders, or connect to a brokerage account.
The scoring systems are rule-based summaries of current chart conditions. They are not win-rate models, machine-learning predictions, or guarantees of future results.
Signals, labels, and dashboard values can vary by symbol, timeframe, liquidity, volatility, and user settings.
The Bias Table is a live context dashboard and may update while the current bar is forming. This is expected behavior because some values are based on developing bar data.
The “Draw visuals only on bar close” setting gates the UT Bot entry visuals and suggested stop/take-profit drawings to confirmed bars. It does not freeze every live dashboard value while a bar is developing.
Liquidity Sweep labels can be gated to bar close using the Bar Close Only setting.
The script is designed for standard chart analysis. Signals on non-standard chart types may behave differently because those chart types can use synthetic price construction.
No signal, score, table reading, or label should be used as a guarantee of future price movement. Users should apply their own analysis and risk management.
🧾 Credits and Inspiration
This script was inspired by the concept of combining a multi-timeframe bias table, trend labels, and a price-level dashboard into one overlay.
The current script is a ground-up Pine Script v6 implementation with additional architecture, including the rule-based Trade Probability Score, Trend Strength Score, liquidity sweep detection, relative strength comparison, volatility state classification, configurable dashboards, candlestick pattern labels, and suggested risk-reference lines.
The script also uses common technical analysis concepts such as moving averages, VWAP, MACD, RSI, ADX, ATR, Supertrend-style trend logic, and Opening Range Breakout logic. These common concepts are organized into a single decision-support framework rather than presented as separate standalone indicators.
📊 Overview
Helix Lucky MTF Trend and Breakout Dashboard is an overlay indicator designed to organize trend, momentum, breakout context, key levels, and multi-timeframe alignment into one chart-based dashboard.
The purpose of the script is not to combine unrelated indicators into a single display. The script separates market analysis into distinct layers so each component has a specific role:
1. Trend structure
2. Momentum confirmation
3. Breakout context
4. Multi-timeframe alignment
5. Key level awareness
6. Setup scoring
7. Optional visual confirmation tools
The result is a confluence-based workflow that helps traders review whether multiple independent conditions are aligned before making a trading decision.
🧩 How the Main Components Work Together
The script uses moving averages, VWAP, MACD, ZLSMA, UT Bot logic, Supertrend, ADX, RSI, and Opening Range Breakout logic as separate inputs within the same framework.
The moving average group provides basic trend structure by comparing shorter-term and longer-term averages. The default structure uses a fast EMA, medium EMA, and long SMA, but users can configure the moving average types and lengths.
VWAP provides session or higher-period price-location context. It can be anchored to the session, day, week, month, quarter, or year and may be displayed with standard deviation or percentage-based bands.
MACD is used as a momentum confirmation layer. The script includes a minimum separation filter so very small MACD differences can be filtered out instead of being treated the same as stronger momentum shifts.
ZLSMA is optional and can be used as an additional trend-direction filter.
The UT Bot component is used as the primary chart label engine. It uses an ATR-based adaptive trailing stop. The script adjusts the trailing distance using volatility, momentum, and volume conditions, then produces Buy or Sell labels when price crosses the trailing stop and the configured filters allow the signal.
Supertrend provides a separate trend-regime layer. This gives the user a second way to compare the UT Bot label against a broader trend condition.
ADX is used to evaluate whether trend strength is above the user-selected threshold. RSI can be used either in a classic 30/70 bias mode or with custom pullback zones.
The Opening Range Breakout component tracks whether price is above, below, or inside the selected opening range window. This helps separate trend-following conditions from range-bound conditions.
🧠 Why This Is More Than a Simple Mashup
Each component is assigned a different purpose. The script is designed so the same tools are not all treated as equal standalone signals.
Trend tools identify direction.
Momentum tools evaluate confirmation.
Volume and relative volume help evaluate participation.
Opening Range Breakout logic identifies range expansion.
The Bias Table compares selected conditions across multiple timeframes.
The Price Point Dashboard displays important reference levels and live context.
The scoring layer organizes these conditions into a rule-based summary.
This structure allows the script to reduce chart clutter while still showing how the underlying conditions agree or disagree.
🕒 Multi-Timeframe Bias Table
The Multi-Timeframe Bias Table displays up to eight selectable timeframes, including 1 minute, 5 minutes, 15 minutes, 30 minutes, 1 hour, 2 hours, 4 hours, and Daily.
Each row evaluates one condition, such as moving average structure, price relative to VWAP, MACD alignment, Supertrend direction, ZLSMA slope, RSI condition, ADX threshold, Opening Range Breakout status, and longer-period bias.
The table also includes an average agreement reading. This reading is not a prediction and does not represent a win rate. It simply shows how many selected conditions are aligned across the active timeframes.
By default, the script can hide timeframes below the current chart timeframe. This is intended to reduce lower-timeframe noise when viewing higher-timeframe charts.
📍 Price Point Dashboard
The Price Point Dashboard displays reference levels and market context in one location. These can include prior day high, prior day low, prior day close, pivot levels, moving averages, 52-week high, Fibonacci reference levels, VWAP information, Opening Range Breakout status, ATR, gap percentage, relative volume, and other selected dashboard fields.
The dashboard is intended to help users see where price is trading relative to important reference levels without manually adding each level to the chart.
📈 Trend Strength Score
The Trend Strength Score is a rule-based 0 to 100 score that measures how strongly the current bar aligns with selected bullish trend conditions.
The score uses five weighted components:
- EMA alignment
- VWAP location
- MACD alignment
- Supertrend direction
- ADX strength
The score is a summary of internal conditions only. It does not predict future price movement.
🎯 Trade Probability Score
The Trade Probability Score is a rule-based 0 to 100 setup-quality score. It is calculated from twelve weighted factors:
- Multi-timeframe alignment
- EMA stack
- VWAP location
- Price relative to the 200-period moving average
- MACD alignment
- Supertrend direction
- ADX strength
- Relative volume
- Opening Range Breakout status
- Relative strength versus a selected benchmark
- Volatility state
- Position relative to key levels
The score is intended to summarize confluence. A higher score means more of the script’s internal conditions are aligned. It does not mean that a trade will be profitable, and it should not be interpreted as a guaranteed probability of success.
💧 Liquidity Sweep Detection
The script can detect liquidity sweep conditions by checking whether price moves beyond a recent swing high or swing low and then closes back inside that level.
A Sweep High label indicates that price moved above a recent high and then closed back below that level.
A Sweep Low label indicates that price moved below a recent low and then closed back above that level.
These labels are intended to identify possible rejection behavior around recent swing points. They should be used as context, not as standalone trade signals.
⚖️ Relative Strength
The script includes relative strength comparison against configurable benchmark symbols. The default benchmarks are QQQ and SPY.
Relative strength is calculated by comparing the current symbol’s intraday return against the benchmark’s intraday return. A positive value means the current symbol is outperforming the benchmark over that comparison period. A negative value means it is underperforming.
🌡️ Volatility State
The Volatility State feature classifies the current volatility environment as Squeeze, Normal, or Expansion.
This is based on Bollinger Band width compared with Keltner Channel width and recent volatility behavior.
Squeeze indicates compressed volatility.
Normal indicates a standard volatility environment.
Expansion indicates that volatility has increased relative to recent conditions.
This feature is included to help users understand whether price is consolidating, behaving normally, or expanding in volatility.
🕯️ Candlestick Pattern Labels
The script includes optional candlestick pattern labels. These patterns are detected on the same timeframe as the chart. They are not calculated from a separate hidden timeframe.
Optional labels include:
- Bullish Engulfing
- Bearish Engulfing
- Hammer
- Shooting Star
- Morning Star
- Evening Star
- Inside Bar
- Tweezer Top
- Tweezer Bottom
- Doji
- Dragonfly Doji
- Gravestone Doji
- Sweep High
- Sweep Low
These labels are intended as additional context. They should not be treated as standalone entries without reviewing trend, momentum, volatility, and key-level context.
🛑 Suggested Stop Loss and Take Profit Reference Lines
The script can plot suggested stop loss and take profit reference lines after a UT Bot label appears.
The stop line is calculated from internal structure such as the UT Bot stop, Supertrend, VWAP, moving average, Donchian floor, and a minimum ATR-based risk floor depending on settings and context.
Take profit reference lines are based on R-multiple distances from the suggested stop. These are visual planning tools only. They do not place trades, manage positions, or execute orders.
🧭 How to Use the Script
A typical workflow is:
1. Select the chart timeframe and market being reviewed.
2. Review the Multi-Timeframe Bias Table to understand directional alignment.
3. Check whether the chart is trending, ranging, breaking out, or consolidating.
4. Review the Price Point Dashboard for key levels and market context.
5. Watch for a UT Bot Buy or Sell label if labels are enabled.
6. Compare the label direction with Supertrend, MACD, VWAP, ADX, and the Bias Table.
7. Review the Trend Strength Score and Trade Probability Score as confluence summaries.
8. Use the suggested stop and take profit reference lines only as visual planning tools.
9. Apply independent risk management and confirm the setup with your own analysis.
🌍 Timeframes and Markets
The script can be applied to different chart timeframes and TradingView-supported markets. Lower timeframes may produce more signals and more noise. Higher timeframes may produce fewer signals but can provide broader context.
The Multi-Timeframe Bias Table is intended to help users avoid looking at a single timeframe in isolation.
⚠️ Important Limitations
This script is an indicator, not a strategy. It does not place trades, backtest trades, manage orders, or connect to a brokerage account.
The scoring systems are rule-based summaries of current chart conditions. They are not win-rate models, machine-learning predictions, or guarantees of future results.
Signals, labels, and dashboard values can vary by symbol, timeframe, liquidity, volatility, and user settings.
The Bias Table is a live context dashboard and may update while the current bar is forming. This is expected behavior because some values are based on developing bar data.
The “Draw visuals only on bar close” setting gates the UT Bot entry visuals and suggested stop/take-profit drawings to confirmed bars. It does not freeze every live dashboard value while a bar is developing.
Liquidity Sweep labels can be gated to bar close using the Bar Close Only setting.
The script is designed for standard chart analysis. Signals on non-standard chart types may behave differently because those chart types can use synthetic price construction.
No signal, score, table reading, or label should be used as a guarantee of future price movement. Users should apply their own analysis and risk management.
🧾 Credits and Inspiration
This script was inspired by the concept of combining a multi-timeframe bias table, trend labels, and a price-level dashboard into one overlay.
The current script is a ground-up Pine Script v6 implementation with additional architecture, including the rule-based Trade Probability Score, Trend Strength Score, liquidity sweep detection, relative strength comparison, volatility state classification, configurable dashboards, candlestick pattern labels, and suggested risk-reference lines.
The script also uses common technical analysis concepts such as moving averages, VWAP, MACD, RSI, ADX, ATR, Supertrend-style trend logic, and Opening Range Breakout logic. These common concepts are organized into a single decision-support framework rather than presented as separate standalone indicators.

Trade with clarity using HelixStrat ➜ helixstrat.com
Declinazione di responsabilità
Le informazioni e le pubblicazioni non sono intese come, e non costituiscono, consulenza o raccomandazioni finanziarie, di investimento, di trading o di altro tipo fornite o approvate da TradingView. Per ulteriori informazioni, consultare i Termini di utilizzo.
Trade with clarity using HelixStrat ➜ helixstrat.com
Declinazione di responsabilità
Le informazioni e le pubblicazioni non sono intese come, e non costituiscono, consulenza o raccomandazioni finanziarie, di investimento, di trading o di altro tipo fornite o approvate da TradingView. Per ulteriori informazioni, consultare i Termini di utilizzo.