ORB Opening Range I EonMetrics
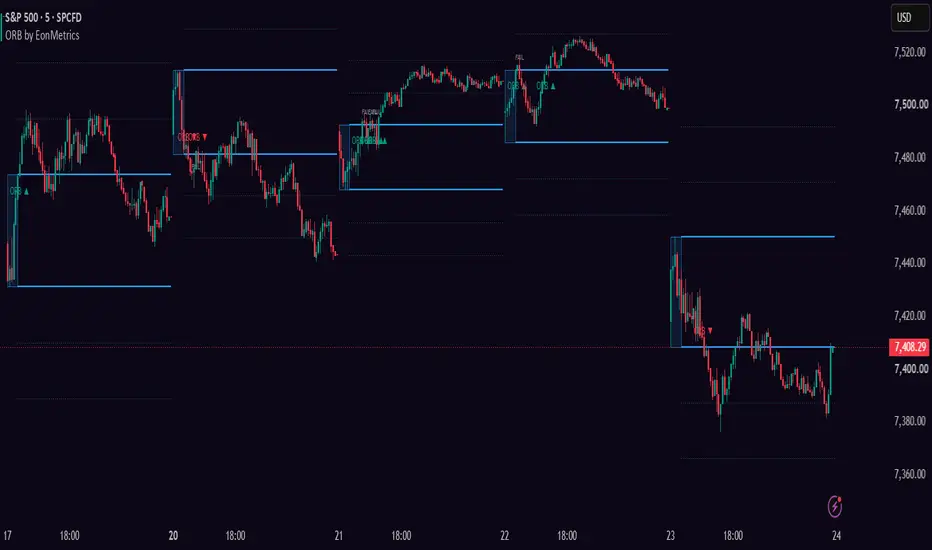
ORB - Opening Range
ORB marks the opening range — the high and low of the first minutes of a session — and tracks what price does with it for the rest of the day: breakouts by closing price, failed breakouts that snap back inside, and extension levels projected from the range height. The last few days stay on the chart so you can judge at a glance how your instrument actually behaves around its open.

🔶HOW IT WORKS
From the session open (New York 09:30 by default) the script records the high and low of the first X minutes — 5 to 60, you choose. When the window closes, the range is frozen: a box marks the window, and the high/low lines extend forward until the next session begins. The first candle that CLOSES outside the range tags the breakout; a close back inside within your chosen number of bars tags it as FAILED and re-arms the day.
🔶WHY THE OPENING RANGE MATTERS
The first minutes of a session concentrate the reactions to everything that accumulated while the market was closed or quiet: overnight news, opening auctions, the first institutional orders of the day. The range those minutes carve out is the day's first agreed-upon value area. That is the reasoning behind the concept, and it is why the tool also tags a move that closes back inside the range rather than only tagging the escape — the two outcomes describe different sessions.
Worth stating plainly: this is the rationale for the concept, not evidence that it works. Whether your instrument respects its opening range is an empirical question about that instrument, and the History setting exists so you can answer it with your own eyes before relying on anything here.
🔶WHAT IT DOES
Opening range — box over the window (5/15/30/45/60 min), frozen high/low lines extended through the session. Session presets: New York 09:30, London 08:00, Tokyo 09:00, or a fully custom open time with its own timezone (DST handled by the timezone database, not by fixed offsets).
Extension levels — optional lines at ±0.5×, ±1×, ±1.5× and ±2× the range height, projected above the high and below the low. These are reference levels for reading how far a move has traveled relative to the range — the script does not call them targets, because they are not.
Breakout status — evaluated on closing prices only, never on wicks. First close above the high tags ORB ▲, first close below the low tags ORB ▼. A close back inside the range within K bars tags FAIL and re-arms the day, so a later genuine breakout can still be tagged.
History — the last D days of ranges stay on the chart (configurable). Scrolling back through a week of your own instrument is the fastest way to see whether its opening range is worth watching at all.
🔶ALERTS
Four alert conditions: opening range set, breakout above, breakout below, failed breakout.
🔶HOW TO USE
1. Pick the session that matches your market — NY 09:30 for US indices and metals, London 08:00 for European hours, or a custom time.
2. Pick the window length. 15 and 30 minutes are the classic choices; shorter = earlier levels, noisier range.
3. Watch the first close outside the range — and read a quick close back inside (the FAIL tag) as a description of that session, not as noise to ignore.
4. Set the four alerts and stop watching the open candle by candle.
🔶SETTINGS
Session (preset / custom time + timezone, range length) · Levels & Breakout (extension multiples, failed-breakout window, days of history) · Style (colors, box fill).
🔶HONEST LIMITATIONS
The opening-range concept assumes a session with a real open — indices, metals, forex sessions. On 24/7 crypto a "session open" is a convention: the tool works there mechanically, but the premise behind it is weaker, and you should know that before trading around it. The chart timeframe must be at or below the window length (a 30-minute range cannot be built from hourly bars — the indicator stays empty rather than guessing). This tool draws levels and states facts about closes; it does not generate signals or targets.
Part of the EonMetrics toolset.
ORB marks the opening range — the high and low of the first minutes of a session — and tracks what price does with it for the rest of the day: breakouts by closing price, failed breakouts that snap back inside, and extension levels projected from the range height. The last few days stay on the chart so you can judge at a glance how your instrument actually behaves around its open.
🔶HOW IT WORKS
From the session open (New York 09:30 by default) the script records the high and low of the first X minutes — 5 to 60, you choose. When the window closes, the range is frozen: a box marks the window, and the high/low lines extend forward until the next session begins. The first candle that CLOSES outside the range tags the breakout; a close back inside within your chosen number of bars tags it as FAILED and re-arms the day.
🔶WHY THE OPENING RANGE MATTERS
The first minutes of a session concentrate the reactions to everything that accumulated while the market was closed or quiet: overnight news, opening auctions, the first institutional orders of the day. The range those minutes carve out is the day's first agreed-upon value area. That is the reasoning behind the concept, and it is why the tool also tags a move that closes back inside the range rather than only tagging the escape — the two outcomes describe different sessions.
Worth stating plainly: this is the rationale for the concept, not evidence that it works. Whether your instrument respects its opening range is an empirical question about that instrument, and the History setting exists so you can answer it with your own eyes before relying on anything here.
🔶WHAT IT DOES
Opening range — box over the window (5/15/30/45/60 min), frozen high/low lines extended through the session. Session presets: New York 09:30, London 08:00, Tokyo 09:00, or a fully custom open time with its own timezone (DST handled by the timezone database, not by fixed offsets).
Extension levels — optional lines at ±0.5×, ±1×, ±1.5× and ±2× the range height, projected above the high and below the low. These are reference levels for reading how far a move has traveled relative to the range — the script does not call them targets, because they are not.
Breakout status — evaluated on closing prices only, never on wicks. First close above the high tags ORB ▲, first close below the low tags ORB ▼. A close back inside the range within K bars tags FAIL and re-arms the day, so a later genuine breakout can still be tagged.
History — the last D days of ranges stay on the chart (configurable). Scrolling back through a week of your own instrument is the fastest way to see whether its opening range is worth watching at all.
🔶ALERTS
Four alert conditions: opening range set, breakout above, breakout below, failed breakout.
🔶HOW TO USE
1. Pick the session that matches your market — NY 09:30 for US indices and metals, London 08:00 for European hours, or a custom time.
2. Pick the window length. 15 and 30 minutes are the classic choices; shorter = earlier levels, noisier range.
3. Watch the first close outside the range — and read a quick close back inside (the FAIL tag) as a description of that session, not as noise to ignore.
4. Set the four alerts and stop watching the open candle by candle.
🔶SETTINGS
Session (preset / custom time + timezone, range length) · Levels & Breakout (extension multiples, failed-breakout window, days of history) · Style (colors, box fill).
🔶HONEST LIMITATIONS
The opening-range concept assumes a session with a real open — indices, metals, forex sessions. On 24/7 crypto a "session open" is a convention: the tool works there mechanically, but the premise behind it is weaker, and you should know that before trading around it. The chart timeframe must be at or below the window length (a 30-minute range cannot be built from hourly bars — the indicator stays empty rather than guessing). This tool draws levels and states facts about closes; it does not generate signals or targets.
Part of the EonMetrics toolset.

Declinazione di responsabilità
Le informazioni e le pubblicazioni non sono intese come, e non costituiscono, consulenza o raccomandazioni finanziarie, di investimento, di trading o di altro tipo fornite o approvate da TradingView. Per ulteriori informazioni, consultare i Termini di utilizzo.
Declinazione di responsabilità
Le informazioni e le pubblicazioni non sono intese come, e non costituiscono, consulenza o raccomandazioni finanziarie, di investimento, di trading o di altro tipo fornite o approvate da TradingView. Per ulteriori informazioni, consultare i Termini di utilizzo.