OPEN-SOURCE SCRIPT
Aroon Money Flow Confluence [MarkitTick]
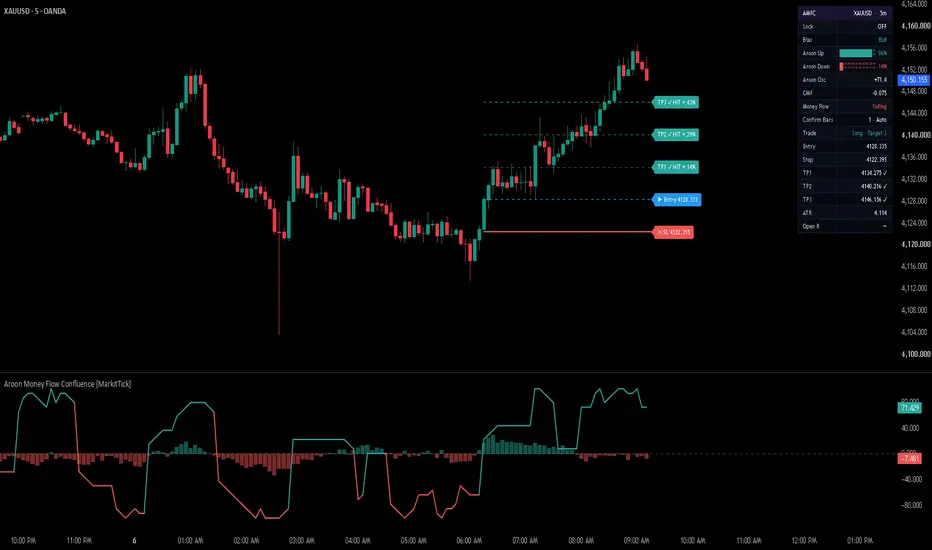
💡 This indicator reads trend direction from two independent angles and acts only when they agree. The first angle is time: the Aroon Oscillator measures how recently price set its highest high versus its lowest low. The second angle is participation: Chaikin Money Flow measures whether closes land in the upper or lower part of each bar's range, weighted by volume. A trade idea is registered only when the Aroon Oscillator and Chaikin Money Flow both point the same way, and the Aroon flip and the money flow agreement happen close together in time. Each confirmed idea is paired with an ATR-based stop and three R-multiple targets, tracked live on the chart, in a dashboard and in alerts.
● Overview
The script runs in its own pane. The pane shows the Aroon Oscillator as a line, Chaikin Money Flow as columns, and a zero line. The trade levels (stop, entry, three targets), the optional confluence candles and the optional dashboard are drawn on the price chart so that everything can be read in one place.
The indicator is a single pane tool that does not place orders and does not run a backtest. It marks where its own rules would have entered, where the stop sits and where each target sits, and it records whether those levels were reached afterwards.
✨ Originality and Utility
Most Aroon-based and money-flow-based tools are used on their own. The Aroon Oscillator is a pure time statistic and ignores volume completely. Chaikin Money Flow is a pure volume-weighted close-location statistic and ignores how long a trend has been in place. Each one alone has a familiar weakness: Aroon lags after price has already moved, and money flow alone can stay positive or negative without a clear trend change.
This script adds three things on top of simply plotting both indicators:
The result is a two-condition filter with a clear, explainable reason for every signal, plus a ready trade frame (stop, three targets, live hit tracking, R-multiple result) so that the idea can be judged against defined risk rather than a bare arrow.
✨ Mashup Justification
The two components were chosen because they answer different questions from different data. Aroon uses only the high and low series and counts bars. Chaikin Money Flow uses close, high, low and volume and measures pressure. They do not share inputs in the same way two price-based oscillators would, so agreement between them carries more information than agreement between, for example, two moving average variants.
The combination is also not arbitrary in how it is wired. The Aroon flip is treated as the timing event, because it marks the moment a new high or new low has become the more recent extreme. Money flow is treated as the permission layer, because it says whether volume-weighted closes support that direction. The confirmation window exists precisely because these two readings rarely turn on the same bar, and the script measures how far apart they usually turn.
🔬 Methodology and Concepts
• Aroon Oscillator
Aroon Up is 100 times (length minus the number of bars since the highest high in the window) divided by length. Aroon Down uses the lowest low the same way. The window holds length plus one bars, so a high set on the current bar reads 100 and a high set exactly length bars ago reads 0. The Aroon Oscillator is Aroon Up minus Aroon Down and is bounded between minus 100 and plus 100.
A positive value means the highest high in the window came more recently than the lowest low. A negative value means the opposite. The indicator was created by Tushar Chande in 1995, and a default length of 14 is used here, which matches the TradingView default. No reading appears until the length plus one bars exist.
• Chaikin Money Flow
For each bar the script computes the money flow multiplier as (2 x close minus high minus low) divided by (high minus low). This equals the standard (close minus low) minus (high minus close), divided by the range. Multiplying by volume gives the money flow volume of the bar. Chaikin Money Flow is the sum of money flow volume over the chosen length divided by the sum of volume over the same length, so it is bounded between minus 1 and plus 1.
Values above zero point to buying pressure and values below zero to selling pressure. The method comes from Marc Chaikin. The common lengths are 20 or 21 bars, and 20 is the default here. Bars where the high equals the low have an undefined multiplier, so the script counts them as zero money flow and also leaves their volume out of the denominator. If the whole window holds no volume, money flow is undefined, no signal can fire and the dashboard says so.
• Flow Buffer
Instead of reading money flow against the zero line alone, a long requires money flow above plus the buffer and a short requires it below minus the buffer. The default buffer is 0.05, which follows the commonly used plus and minus 0.05 thresholds that reduce false zero-line crosses. Setting it to 0 returns to the zero line.
• Agreement and the signal rule
Bullish agreement means the Aroon Oscillator is above zero and money flow is above the buffer. Bearish agreement means the Aroon Oscillator is below zero and money flow is below the negative buffer. A long idea is registered on the bar where bullish agreement newly begins, provided the Aroon Oscillator crossed above zero within the confirmation window. A short idea works the same way in the opposite direction. Only closed bars can register an idea.
This means three cases are filtered out: agreement that was already present on the previous bar, agreement that begins long after the last Aroon flip, and an Aroon flip that money flow never joins.
• Confirmation window
The window is the number of bars that may pass between the Aroon zero cross and the start of agreement. With Auto Confirm on, the script records the gap every time an Aroon flip is followed by agreement within 20 bars. It keeps the latest 20 gaps and uses their median, kept between 1 and 20 bars. The median is used because a single unusual gap does not move it much. Until 5 gaps have been measured, the window is about a quarter of the CMF length, which gives 5 bars at the default of 20.
With Auto Confirm off, the Confirm Bars input is used directly. A value of 0 requires money flow to agree on the same bar the Aroon Oscillator crosses zero.
• Smoothing options
Both the Aroon Oscillator and money flow can be smoothed before any rule reads them. The choices are EMA, RMA, WMA, HMA, KAMA and Kalman, with None as the default. KAMA adapts its speed to an efficiency ratio, which is net change divided by total movement over the length, so it slows down in noisy conditions and speeds up in directional ones. The Kalman option is a one-dimensional recursive estimator whose process noise scales as one divided by the length against a fixed measurement noise, so a longer length gives a steadier line. Smoothing makes the lines calmer but adds lag, and the first smoothed values can appear later than the raw ones.
• Trade frame
The entry is the close of the signal bar. The stop distance is the ATR multiplied by the stop multiplier, which is 14 bars and 1.5 by default. The three targets sit at multiples of that stop distance, 1R, 2R and 3R by default. If the target multiples are entered out of order, they are sorted from nearest to farthest and the dashboard shows a warning.
After the signal bar, a target counts as reached when the bar's high (for longs) or low (for shorts) touches it. The stop counts as hit when a bar closes beyond it, which means a brief wick through the stop level does not end the trade. Reaching the third target closes the trade. A new signal replaces any open trade, and that replacement is reported as a close followed by a new entry.
• Optional filters
🎨 Visual Guide
• Dashboard
The dashboard has a header with the short name, the symbol and the timeframe, followed by rows with these meanings:
With the dashboard switched off, only the active warning rows remain visible. The dashboard can be drawn on the price chart or kept inside the pane, and it can be placed in any of the four corners.
📖 How to Use
The indicator works on standard chart types only. On Renko, Kagi, Line break, Point and figure, Range or Heikin Ashi charts, it stops with an error message, because those chart types produce unrealistic results for signal logic.
⚙️ Inputs and Settings
• Core
• Filters
• Trade Tools
• Visuals, Dashboard and Colors
• Alerts
Six alert conditions are available: Buy Signal, Sell Signal, Close Long, Close Short, Partial Close Long and Partial Close Short. Alert messages are also sent as structured text containing the action word, the symbol, the timeframe, the direction, and for entries the entry, stop, three targets and the current Aroon and money flow values. The action words for long, short, close and partial close can be edited in the inputs. Entry and stop alerts fire once per closed bar, and target alerts fire once per bar.
🔍 Deconstruction of the Underlying Scientific and Academic Framework
• Aroon as a time-based order statistic
Aroon discards price magnitude and keeps only the position in time of the window maximum and minimum. This is a rank-based idea: it asks where in a window of recent observations the extreme value sits, not how large it is. Because it uses only the ordering of values, it is insensitive to the scale of the instrument and to the size of any single spike. The oscillator then compares the recency of the maximum against the recency of the minimum, which gives a bounded measure of whether the window's extremes are being set up or down.
The statistical consequence is that Aroon responds to the sequence of new extremes, which is the defining feature of a trending series, and tends to drift toward zero in a range where highs and lows alternate. Its weakness follows from the same property: an extreme can only be recognised after it has formed and remains in the window, so the reading lags.
• Chaikin Money Flow as a volume-weighted average of close location
The money flow multiplier is the close location value, which places the close inside the bar's range on a scale from minus 1 to plus 1. Weighting it by volume and dividing by total volume turns it into a volume-weighted average of close location over the window. This is a weighted mean, so the result is bounded by construction and is comparable across instruments.
The measure assumes that a close near the top of the range reflects buying pressure and a close near the bottom reflects selling pressure, and it gives more weight to bars with more participation. It does not see gaps between bars or activity inside the bar beyond the high, low and close, which is a recognised limitation of the method.
• Why combine a rank statistic with a weighted mean
The two measures are built from different information. One uses the ordering of highs and lows over time. The other uses a volume-weighted average of closing position. Requiring both to agree is a simple form of evidence combination: a condition that two partly independent measurements both support is less likely to come from noise in a single measurement than a condition supported by one measurement alone. The confirmation window addresses the fact that a time-based statistic and a pressure-based statistic reach their turning points at different speeds.
The median used to estimate the window is a robust location estimate. Unlike an average, it is not pulled far by one unusually long gap, which suits a small, changing sample of at most 20 observations.
• Smoothing filters
The optional smoothers belong to the family of recursive and weighted filters. EMA and RMA apply exponentially declining weights with different smoothing constants. WMA applies linearly declining weights. HMA combines weighted averages to reduce lag. KAMA scales its smoothing constant by an efficiency ratio, which compares net displacement with total path length, so its responsiveness depends on how directional the recent data is. The Kalman option is a scalar recursive estimator that blends the previous estimate with the new observation using a gain computed from the estimate's uncertainty. All of them trade lag against noise, and none removes lag entirely.
• Volatility-scaled risk and R-multiples
The stop distance is a multiple of the Average True Range, a volatility measure that accounts for gaps between bars. Scaling the stop to volatility makes the distance adapt to current conditions instead of staying fixed in price terms. Targets are expressed as multiples of that distance, called R-multiples, so every outcome can be compared with the risk taken on that idea. The Open R row applies the same unit to the open result.
● Limitations and Live-Bar Behavior
⚠️ Disclaimer
All provided scripts and indicators are strictly for educational exploration and must not be interpreted as financial advice or a recommendation to execute trades. We expressly disclaim all liability for any financial losses or damages that may result, directly or indirectly, from the reliance on or application of these tools. Market participation carries inherent risk where past performance never guarantees future returns, leaving all investment decisions and due diligence solely at your own discretion.
● Overview
The script runs in its own pane. The pane shows the Aroon Oscillator as a line, Chaikin Money Flow as columns, and a zero line. The trade levels (stop, entry, three targets), the optional confluence candles and the optional dashboard are drawn on the price chart so that everything can be read in one place.
The indicator is a single pane tool that does not place orders and does not run a backtest. It marks where its own rules would have entered, where the stop sits and where each target sits, and it records whether those levels were reached afterwards.
✨ Originality and Utility
Most Aroon-based and money-flow-based tools are used on their own. The Aroon Oscillator is a pure time statistic and ignores volume completely. Chaikin Money Flow is a pure volume-weighted close-location statistic and ignores how long a trend has been in place. Each one alone has a familiar weakness: Aroon lags after price has already moved, and money flow alone can stay positive or negative without a clear trend change.
This script adds three things on top of simply plotting both indicators:
- An agreement rule: both readings must be on the same side at the same time, and money flow must clear a buffer around zero rather than merely touching the zero line.
- A timing rule: the agreement must begin within a limited number of bars after the Aroon Oscillator crosses zero, so an old Aroon trend that money flow later joins by chance does not produce a late entry.
- A self-measured confirmation window: with Auto Confirm on, the allowed gap between the Aroon flip and the money flow agreement is measured from the chart's own history instead of being a fixed number the user must guess.
The result is a two-condition filter with a clear, explainable reason for every signal, plus a ready trade frame (stop, three targets, live hit tracking, R-multiple result) so that the idea can be judged against defined risk rather than a bare arrow.
✨ Mashup Justification
The two components were chosen because they answer different questions from different data. Aroon uses only the high and low series and counts bars. Chaikin Money Flow uses close, high, low and volume and measures pressure. They do not share inputs in the same way two price-based oscillators would, so agreement between them carries more information than agreement between, for example, two moving average variants.
The combination is also not arbitrary in how it is wired. The Aroon flip is treated as the timing event, because it marks the moment a new high or new low has become the more recent extreme. Money flow is treated as the permission layer, because it says whether volume-weighted closes support that direction. The confirmation window exists precisely because these two readings rarely turn on the same bar, and the script measures how far apart they usually turn.
🔬 Methodology and Concepts
• Aroon Oscillator
Aroon Up is 100 times (length minus the number of bars since the highest high in the window) divided by length. Aroon Down uses the lowest low the same way. The window holds length plus one bars, so a high set on the current bar reads 100 and a high set exactly length bars ago reads 0. The Aroon Oscillator is Aroon Up minus Aroon Down and is bounded between minus 100 and plus 100.
A positive value means the highest high in the window came more recently than the lowest low. A negative value means the opposite. The indicator was created by Tushar Chande in 1995, and a default length of 14 is used here, which matches the TradingView default. No reading appears until the length plus one bars exist.
• Chaikin Money Flow
For each bar the script computes the money flow multiplier as (2 x close minus high minus low) divided by (high minus low). This equals the standard (close minus low) minus (high minus close), divided by the range. Multiplying by volume gives the money flow volume of the bar. Chaikin Money Flow is the sum of money flow volume over the chosen length divided by the sum of volume over the same length, so it is bounded between minus 1 and plus 1.
Values above zero point to buying pressure and values below zero to selling pressure. The method comes from Marc Chaikin. The common lengths are 20 or 21 bars, and 20 is the default here. Bars where the high equals the low have an undefined multiplier, so the script counts them as zero money flow and also leaves their volume out of the denominator. If the whole window holds no volume, money flow is undefined, no signal can fire and the dashboard says so.
• Flow Buffer
Instead of reading money flow against the zero line alone, a long requires money flow above plus the buffer and a short requires it below minus the buffer. The default buffer is 0.05, which follows the commonly used plus and minus 0.05 thresholds that reduce false zero-line crosses. Setting it to 0 returns to the zero line.
• Agreement and the signal rule
Bullish agreement means the Aroon Oscillator is above zero and money flow is above the buffer. Bearish agreement means the Aroon Oscillator is below zero and money flow is below the negative buffer. A long idea is registered on the bar where bullish agreement newly begins, provided the Aroon Oscillator crossed above zero within the confirmation window. A short idea works the same way in the opposite direction. Only closed bars can register an idea.
This means three cases are filtered out: agreement that was already present on the previous bar, agreement that begins long after the last Aroon flip, and an Aroon flip that money flow never joins.
• Confirmation window
The window is the number of bars that may pass between the Aroon zero cross and the start of agreement. With Auto Confirm on, the script records the gap every time an Aroon flip is followed by agreement within 20 bars. It keeps the latest 20 gaps and uses their median, kept between 1 and 20 bars. The median is used because a single unusual gap does not move it much. Until 5 gaps have been measured, the window is about a quarter of the CMF length, which gives 5 bars at the default of 20.
With Auto Confirm off, the Confirm Bars input is used directly. A value of 0 requires money flow to agree on the same bar the Aroon Oscillator crosses zero.
• Smoothing options
Both the Aroon Oscillator and money flow can be smoothed before any rule reads them. The choices are EMA, RMA, WMA, HMA, KAMA and Kalman, with None as the default. KAMA adapts its speed to an efficiency ratio, which is net change divided by total movement over the length, so it slows down in noisy conditions and speeds up in directional ones. The Kalman option is a one-dimensional recursive estimator whose process noise scales as one divided by the length against a fixed measurement noise, so a longer length gives a steadier line. Smoothing makes the lines calmer but adds lag, and the first smoothed values can appear later than the raw ones.
• Trade frame
The entry is the close of the signal bar. The stop distance is the ATR multiplied by the stop multiplier, which is 14 bars and 1.5 by default. The three targets sit at multiples of that stop distance, 1R, 2R and 3R by default. If the target multiples are entered out of order, they are sorted from nearest to farthest and the dashboard shows a warning.
After the signal bar, a target counts as reached when the bar's high (for longs) or low (for shorts) touches it. The stop counts as hit when a bar closes beyond it, which means a brief wick through the stop level does not end the trade. Reaching the third target closes the trade. A new signal replaces any open trade, and that replacement is reported as a close followed by a new entry.
• Optional filters
- HTF Confirm: a long needs the higher timeframe Aroon Oscillator above zero and a short needs it below zero. The higher timeframe value is taken from the last completed higher timeframe bar only. A higher timeframe lower than the chart timeframe is skipped and flagged on the dashboard.
- Trend Strength: a signal needs the previous bar's ADX to be at or above the minimum, 20 by default, using the chosen ADX length.
🎨 Visual Guide
- The thick line in the pane is the Aroon Oscillator. It is teal while at or above zero and red while below zero, using the Bull and Bear colors.
- The columns in the pane are Chaikin Money Flow multiplied by 100, so they read in percent. Teal columns are at or above zero and red columns are below zero, both semi-transparent.
- The dashed grey horizontal line is the zero line of the pane.
- With Candles enabled, the whole price candle is colored by the confluence state: teal when the Aroon Oscillator and money flow agree upward, red when they agree downward, and grey when they do not agree. These candles are drawn over the normal chart candles.
- When a signal registers, the price chart receives a solid red thick line for the stop, a dashed blue line for the entry and three dashed teal lines for the targets. The target lines get progressively more opaque from TP1 to TP3.
- Each line carries a label at its right end. The labels show the stop, the entry and TP1 to TP3 with their prices. If two levels round to the same price, they share one label with combined names.
- When a level is reached, its label changes to show that it was hit together with the percentage distance from the entry. The stop label shows the percentage at the closing price.
- Lines extend ten bars past the latest bar while a trade is open, and stop at ten bars past the bar where the trade closed.
• Dashboard
The dashboard has a header with the short name, the symbol and the timeframe, followed by rows with these meanings:
- Lock: shows whether Lock Signal is active.
- Bias: Bull, Bear or Neutral from the sign of the Aroon Oscillator.
- Aroon Up and Aroon Down: ten-segment progress bars with a percentage. They turn teal at 66 percent and above, amber from 33 to 66 percent and red below 33 percent. These two rows show raw values even when smoothing is on.
- Aroon Osc and CMF: the current numeric values.
- Money Flow: Buying, Selling or Neutral against the flow buffer.
- Confirm Bars: the window in use, marked Auto or Manual.
- Trade: Flat, or Long or Short with the state Open, Target 1, Target 2, Target 3 or Stopped.
- Entry, Stop, TP1, TP2, TP3 and ATR: the prices of the current trade, with a mark after a level that was reached.
- Open R: the open trade result at the current close, in multiples of the stop distance.
- HTF, ADX Prev and Smoothing: shown only while those features are on. The HTF value is green when the higher timeframe agrees with the current bias.
- Volume and Targets: amber warning rows that appear when no volume exists in the window or when the target multiples were reordered.
With the dashboard switched off, only the active warning rows remain visible. The dashboard can be drawn on the price chart or kept inside the pane, and it can be placed in any of the four corners.
📖 How to Use
- Add the indicator and leave the defaults to start. The pane will show the Aroon Oscillator line and the money flow columns.
- Read the line and the columns together. Both teal means upward agreement, both red means downward agreement. When one is teal and the other red, the two readings disagree and no new idea will form.
- Wait for a confirmed idea. A long idea appears on a closed bar when agreement turns up soon after the Aroon Oscillator crossed above zero. A short idea is the mirror image.
- Use the drawn levels as a defined risk frame. The stop is set from volatility, and the targets show how far price must travel for 1R, 2R and 3R.
- Watch the Trade and Open R rows to see how the current idea is developing, and watch the label changes to see which levels were reached.
- If you want fewer ideas, add HTF Confirm or Trend Strength, enlarge the Flow Buffer or apply smoothing. If you want more ideas, reduce the buffer or widen the Confirm Bars value with Auto Confirm off.
- Check results on the symbols and timeframes you trade before relying on any setting, and size positions according to your own risk limits.
The indicator works on standard chart types only. On Renko, Kagi, Line break, Point and figure, Range or Heikin Ashi charts, it stops with an error message, because those chart types produce unrealistic results for signal logic.
⚙️ Inputs and Settings
• Core
- Aroon Length: the window for the highest high and lowest low. Shorter values react faster and flip more often, longer values are steadier.
- CMF Length: the number of bars summed for money flow. It also sets the starting confirmation window.
- Flow Buffer: how far money flow must be from zero to count as agreement.
- Auto Confirm: measures the confirmation window from the chart's own history.
- Confirm Bars: the manual window, used only while Auto Confirm is off.
• Filters
- HTF Confirm and HTF: require the higher timeframe Aroon Oscillator to agree.
- Trend Strength, ADX Length and ADX Min: require a minimum ADX on the previous bar.
- Smoothing and Smooth Length: choose a smoothing method and its length for both oscillators.
• Trade Tools
- Lock Signal: freezes the current trade and blocks new signals on the live bar.
- ATR Length and SL ATR x: set the stop distance.
- TP1 R, TP2 R and TP3 R: set the target distances as multiples of the stop distance.
• Visuals, Dashboard and Colors
- Switches for the trade levels, the confluence candles, the Aroon line, the money flow columns and the zero line.
- Dashboard visibility, corner position and whether it is drawn on the price chart.
- Every color used by the lines, columns, candles, levels, labels and dashboard can be changed.
• Alerts
Six alert conditions are available: Buy Signal, Sell Signal, Close Long, Close Short, Partial Close Long and Partial Close Short. Alert messages are also sent as structured text containing the action word, the symbol, the timeframe, the direction, and for entries the entry, stop, three targets and the current Aroon and money flow values. The action words for long, short, close and partial close can be edited in the inputs. Entry and stop alerts fire once per closed bar, and target alerts fire once per bar.
🔍 Deconstruction of the Underlying Scientific and Academic Framework
• Aroon as a time-based order statistic
Aroon discards price magnitude and keeps only the position in time of the window maximum and minimum. This is a rank-based idea: it asks where in a window of recent observations the extreme value sits, not how large it is. Because it uses only the ordering of values, it is insensitive to the scale of the instrument and to the size of any single spike. The oscillator then compares the recency of the maximum against the recency of the minimum, which gives a bounded measure of whether the window's extremes are being set up or down.
The statistical consequence is that Aroon responds to the sequence of new extremes, which is the defining feature of a trending series, and tends to drift toward zero in a range where highs and lows alternate. Its weakness follows from the same property: an extreme can only be recognised after it has formed and remains in the window, so the reading lags.
• Chaikin Money Flow as a volume-weighted average of close location
The money flow multiplier is the close location value, which places the close inside the bar's range on a scale from minus 1 to plus 1. Weighting it by volume and dividing by total volume turns it into a volume-weighted average of close location over the window. This is a weighted mean, so the result is bounded by construction and is comparable across instruments.
The measure assumes that a close near the top of the range reflects buying pressure and a close near the bottom reflects selling pressure, and it gives more weight to bars with more participation. It does not see gaps between bars or activity inside the bar beyond the high, low and close, which is a recognised limitation of the method.
• Why combine a rank statistic with a weighted mean
The two measures are built from different information. One uses the ordering of highs and lows over time. The other uses a volume-weighted average of closing position. Requiring both to agree is a simple form of evidence combination: a condition that two partly independent measurements both support is less likely to come from noise in a single measurement than a condition supported by one measurement alone. The confirmation window addresses the fact that a time-based statistic and a pressure-based statistic reach their turning points at different speeds.
The median used to estimate the window is a robust location estimate. Unlike an average, it is not pulled far by one unusually long gap, which suits a small, changing sample of at most 20 observations.
• Smoothing filters
The optional smoothers belong to the family of recursive and weighted filters. EMA and RMA apply exponentially declining weights with different smoothing constants. WMA applies linearly declining weights. HMA combines weighted averages to reduce lag. KAMA scales its smoothing constant by an efficiency ratio, which compares net displacement with total path length, so its responsiveness depends on how directional the recent data is. The Kalman option is a scalar recursive estimator that blends the previous estimate with the new observation using a gain computed from the estimate's uncertainty. All of them trade lag against noise, and none removes lag entirely.
• Volatility-scaled risk and R-multiples
The stop distance is a multiple of the Average True Range, a volatility measure that accounts for gaps between bars. Scaling the stop to volatility makes the distance adapt to current conditions instead of staying fixed in price terms. Targets are expressed as multiples of that distance, called R-multiples, so every outcome can be compared with the risk taken on that idea. The Open R row applies the same unit to the open result.
● Limitations and Live-Bar Behavior
- Both Aroon and Chaikin Money Flow lag, because they describe what price has already done. Ideas can arrive after a move has started, and a reversal can follow an idea.
- On the latest, unclosed bar, the Aroon line, the money flow columns, the dashboard values and the target-touch tracking update with each tick. New ideas and stop hits are decided only when a bar closes, but a target touch can be recorded intrabar and may be seen on a live bar. Reload the chart to see the confirmed history.
- Chaikin Money Flow depends on volume. On feeds that report tick volume, which counts trades and not units traded, the readings reflect trade activity and not size. Symbols with no volume produce no ideas.
- The higher timeframe filter reads the last completed higher timeframe bar, so it cannot use unfinished data, but it also reacts to a higher timeframe change only after that bar closes.
- Smoothing, a larger flow buffer and the optional filters reduce the number of ideas and add delay.
- Auto Confirm learns from the loaded chart history, so its window can differ between symbols, timeframes and the amount of history loaded.
- The drawn levels illustrate a defined risk frame. They do not account for slippage, spreads, commissions or gaps through the stop.
⚠️ Disclaimer
All provided scripts and indicators are strictly for educational exploration and must not be interpreted as financial advice or a recommendation to execute trades. We expressly disclaim all liability for any financial losses or damages that may result, directly or indirectly, from the reliance on or application of these tools. Market participation carries inherent risk where past performance never guarantees future returns, leaving all investment decisions and due diligence solely at your own discretion.
Script open-source
Nello spirito di TradingView, l'autore di questo script lo ha reso open source, in modo che i trader possano esaminarne e verificarne la funzionalità. Complimenti all'autore! Sebbene sia possibile utilizzarlo gratuitamente, ricordiamo che la ripubblicazione del codice è soggetta al nostro Regolamento.

💡 Proprietary indicators. Original research. Built by analysts who trade.
📢 Free Telegram: t.me/MarkitTick_Updates
👑 Premium: TradingView Marketplace
📘 Guides: markittick.com
📢 Free Telegram: t.me/MarkitTick_Updates
👑 Premium: TradingView Marketplace
📘 Guides: markittick.com
Declinazione di responsabilità
Le informazioni e le pubblicazioni non sono intese come, e non costituiscono, consulenza o raccomandazioni finanziarie, di investimento, di trading o di altro tipo fornite o approvate da TradingView. Per ulteriori informazioni, consultare i Termini di utilizzo.
Script open-source
Nello spirito di TradingView, l'autore di questo script lo ha reso open source, in modo che i trader possano esaminarne e verificarne la funzionalità. Complimenti all'autore! Sebbene sia possibile utilizzarlo gratuitamente, ricordiamo che la ripubblicazione del codice è soggetta al nostro Regolamento.
💡 Proprietary indicators. Original research. Built by analysts who trade.
📢 Free Telegram: t.me/MarkitTick_Updates
👑 Premium: TradingView Marketplace
📘 Guides: markittick.com
📢 Free Telegram: t.me/MarkitTick_Updates
👑 Premium: TradingView Marketplace
📘 Guides: markittick.com
Declinazione di responsabilità
Le informazioni e le pubblicazioni non sono intese come, e non costituiscono, consulenza o raccomandazioni finanziarie, di investimento, di trading o di altro tipo fornite o approvate da TradingView. Per ulteriori informazioni, consultare i Termini di utilizzo.