OPEN-SOURCE SCRIPT
Tick Velocity [DYNA]
Tick Velocity measures the speed of price movement on every bar, normalized by ATR and log-compressed so the reading works consistently across any instrument and any timeframe. Instead of asking "did price go up or down?" it asks "how fast did price move?" -- and that distinction makes all the difference when you need to spot momentum bursts and exhaustion in real time.
Most momentum tools tell you the direction of a move but not its intensity relative to normal conditions. A 50-point move on a major index means something very different during a quiet afternoon versus an opening-bell surge. Tick Velocity strips away that ambiguity by expressing every bar's price change as a multiple of recent volatility with log compression, giving you a clean, comparable speed reading that doesn't get crushed by outlier spikes.
Key Features
How It Works
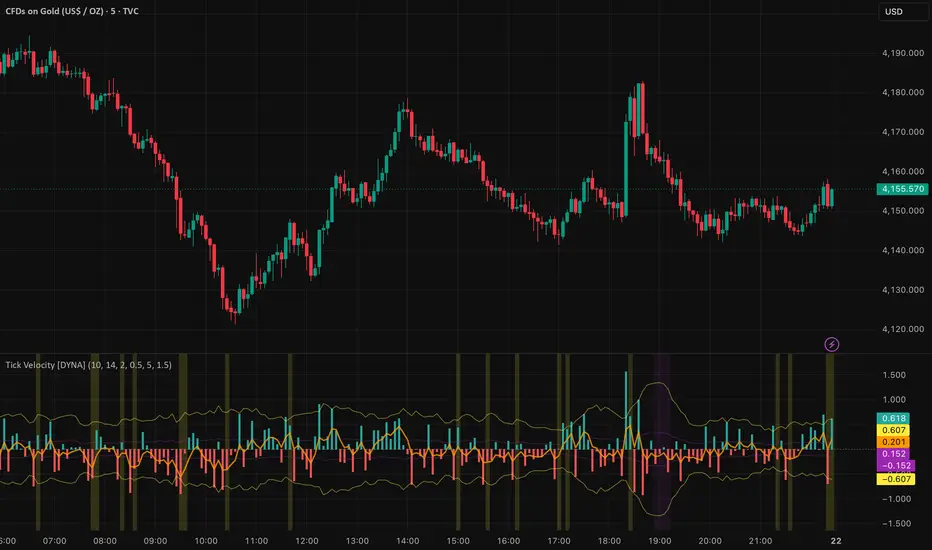
When you add Tick Velocity to your chart, a histogram appears in a separate pane below price. Each bar in the histogram represents the speed of that candle's price change: green bars mean price moved up, red bars mean price moved down, and the height of each bar shows how fast the move was. Log compression keeps the scale readable -- a massive gap-up spike won't flatten everything else into an invisible line.
An orange signal line (EMA) overlays the histogram, smoothing out bar-to-bar noise to show you the sustained momentum direction. When the signal line holds above zero, bulls are in control; when it dips below, bears are driving.
Two sets of threshold lines frame the histogram. The outer yellow lines mark the spike threshold -- when a bar pushes beyond these lines, price moved significantly faster than normal, indicating a momentum burst. The inner purple lines mark the exhaustion threshold -- when bars shrink inside these lines after a period of elevated activity, momentum is fading and the market may be pausing or preparing to reverse. The smart exhaustion gate ensures purple zones only appear after real momentum -- not during quiet consolidation.
Background shading reinforces these conditions. A yellow tint appears on confirmed spike bars, and a purple tint appears on confirmed exhaustion bars, making it easy to scan through the chart and see where momentum surged or faded.

Tick Velocity histogram showing bullish and bearish velocity bars, with spike threshold lines (yellow) and exhaustion bands (purple). Background highlights mark confirmed spike and exhaustion events.
Settings
The core settings control sensitivity. The Velocity Lookback (default 10) determines how many bars are used to calculate the average velocity -- lower values make the indicator more responsive for scalping, higher values smooth it out for swing trading. The ATR Period (default 14) controls the normalization window. The Signal Smoothing (default 5) sets the EMA period for the orange signal line.
The Spike Multiplier (default 2.0) sets how far above average a bar must travel to count as a spike. Raise it to 2.5 or 3.0 if you only want the strongest bursts. The Exhaustion Multiplier (default 0.5) sets how far below average velocity must drop to flag exhaustion. The Exhaustion Gate Multiplier (default 1.5) ensures exhaustion only triggers when recent activity exceeds the longer-term baseline by this factor -- preventing false signals during quiet consolidation. Threshold lines, background highlights, and the signal line can each be toggled independently under Visual settings.
Alerts
To set up alerts: click the TradingView Alerts button, select "Tick Velocity [DYNA]" from the indicator dropdown, choose "Any alert() function call" as the condition, and set your preferred notification method.
Best Practices
Part of the DYNA Ecosystem
Tick Velocity is a free indicator built with the same design standards as the DYNA premium suite. For complete trade management with automatic stop loss, break-even, trailing stops, and multi-target systems, explore the full DYNA indicator collection.
Disclaimer
This indicator is a technical analysis and educational tool only -- it is not financial advice and makes no guarantee of any outcome. Past performance does not predict future results. Always do your own research and use proper position sizing and risk management.
Created by Varun Nidhi · varunnidhi.com
A free DYNA indicator — self-contained, no repainting.
Most momentum tools tell you the direction of a move but not its intensity relative to normal conditions. A 50-point move on a major index means something very different during a quiet afternoon versus an opening-bell surge. Tick Velocity strips away that ambiguity by expressing every bar's price change as a multiple of recent volatility with log compression, giving you a clean, comparable speed reading that doesn't get crushed by outlier spikes.
Key Features
- ATR-Normalized Velocity -- price change divided by ATR, so readings are comparable across instruments and timeframes without manual adjustment
- Log-Compressed Scale -- extreme spikes are tamed so the histogram uses its full visual range, making normal-range momentum readable even after outlier moves
- Signal Line -- a smoothed EMA overlay shows sustained momentum direction, filtering out bar-to-bar noise
- Dynamic Spike Detection -- automatically identifies bars where velocity exceeds a configurable multiple of its recent average, with separate bullish and bearish alerts
- Smart Exhaustion Detection -- flags fading momentum only after periods of genuine activity, so you don't get false exhaustion signals during quiet consolidation
- Confirmed-Bar Logic -- all signals are evaluated on the completed bar, so what you see on the chart stays on the chart with no repainting
- Clean Visual Design -- color-coded histogram with dynamic threshold lines and signal line makes it easy to read momentum state at a glance
How It Works
When you add Tick Velocity to your chart, a histogram appears in a separate pane below price. Each bar in the histogram represents the speed of that candle's price change: green bars mean price moved up, red bars mean price moved down, and the height of each bar shows how fast the move was. Log compression keeps the scale readable -- a massive gap-up spike won't flatten everything else into an invisible line.
An orange signal line (EMA) overlays the histogram, smoothing out bar-to-bar noise to show you the sustained momentum direction. When the signal line holds above zero, bulls are in control; when it dips below, bears are driving.
Two sets of threshold lines frame the histogram. The outer yellow lines mark the spike threshold -- when a bar pushes beyond these lines, price moved significantly faster than normal, indicating a momentum burst. The inner purple lines mark the exhaustion threshold -- when bars shrink inside these lines after a period of elevated activity, momentum is fading and the market may be pausing or preparing to reverse. The smart exhaustion gate ensures purple zones only appear after real momentum -- not during quiet consolidation.
Background shading reinforces these conditions. A yellow tint appears on confirmed spike bars, and a purple tint appears on confirmed exhaustion bars, making it easy to scan through the chart and see where momentum surged or faded.
Tick Velocity histogram showing bullish and bearish velocity bars, with spike threshold lines (yellow) and exhaustion bands (purple). Background highlights mark confirmed spike and exhaustion events.
Settings
The core settings control sensitivity. The Velocity Lookback (default 10) determines how many bars are used to calculate the average velocity -- lower values make the indicator more responsive for scalping, higher values smooth it out for swing trading. The ATR Period (default 14) controls the normalization window. The Signal Smoothing (default 5) sets the EMA period for the orange signal line.
The Spike Multiplier (default 2.0) sets how far above average a bar must travel to count as a spike. Raise it to 2.5 or 3.0 if you only want the strongest bursts. The Exhaustion Multiplier (default 0.5) sets how far below average velocity must drop to flag exhaustion. The Exhaustion Gate Multiplier (default 1.5) ensures exhaustion only triggers when recent activity exceeds the longer-term baseline by this factor -- preventing false signals during quiet consolidation. Threshold lines, background highlights, and the signal line can each be toggled independently under Visual settings.
Alerts
- Bullish Velocity Spike -- fires when upward velocity exceeds the spike threshold on a confirmed bar. Message: "Bullish velocity spike -- strong upward momentum burst."
- Bearish Velocity Spike -- fires when downward velocity exceeds the spike threshold on a confirmed bar. Message: "Bearish velocity spike -- strong downward momentum burst."
- Velocity Exhaustion -- fires when velocity drops below the exhaustion threshold after a period of elevated activity. Message: "Tick Velocity exhaustion detected -- momentum fading after active period, possible pause or reversal."
To set up alerts: click the TradingView Alerts button, select "Tick Velocity [DYNA]" from the indicator dropdown, choose "Any alert() function call" as the condition, and set your preferred notification method.
Best Practices
- Use velocity spikes at key support and resistance levels to confirm breakouts -- a spike adds conviction that the level break is real
- Watch for exhaustion signals after extended trends to time profit-taking or tighten stop-loss placement
- Combine with volume indicators for added confirmation -- a velocity spike on high volume is more meaningful than one on thin volume
- Adjust the lookback period to match your trading style: 5-7 for scalping, 10-15 for intraday, 20+ for swing trading
- On lower timeframes (1-3 minute), consider raising the spike multiplier to reduce noise from normal market fluctuations
Part of the DYNA Ecosystem
Tick Velocity is a free indicator built with the same design standards as the DYNA premium suite. For complete trade management with automatic stop loss, break-even, trailing stops, and multi-target systems, explore the full DYNA indicator collection.
Disclaimer
This indicator is a technical analysis and educational tool only -- it is not financial advice and makes no guarantee of any outcome. Past performance does not predict future results. Always do your own research and use proper position sizing and risk management.
Created by Varun Nidhi · varunnidhi.com
A free DYNA indicator — self-contained, no repainting.
Script open-source
Nello spirito di TradingView, l'autore di questo script lo ha reso open source, in modo che i trader possano esaminarne e verificarne la funzionalità. Complimenti all'autore! Sebbene sia possibile utilizzarlo gratuitamente, ricordiamo che la ripubblicazione del codice è soggetta al nostro Regolamento.

Declinazione di responsabilità
Le informazioni e le pubblicazioni non sono intese come, e non costituiscono, consulenza o raccomandazioni finanziarie, di investimento, di trading o di altro tipo fornite o approvate da TradingView. Per ulteriori informazioni, consultare i Termini di utilizzo.
Script open-source
Nello spirito di TradingView, l'autore di questo script lo ha reso open source, in modo che i trader possano esaminarne e verificarne la funzionalità. Complimenti all'autore! Sebbene sia possibile utilizzarlo gratuitamente, ricordiamo che la ripubblicazione del codice è soggetta al nostro Regolamento.
Declinazione di responsabilità
Le informazioni e le pubblicazioni non sono intese come, e non costituiscono, consulenza o raccomandazioni finanziarie, di investimento, di trading o di altro tipo fornite o approvate da TradingView. Per ulteriori informazioni, consultare i Termini di utilizzo.