OPEN-SOURCE SCRIPT
Aggiornato Daily/Weekly EMAs on Lower Timeframes
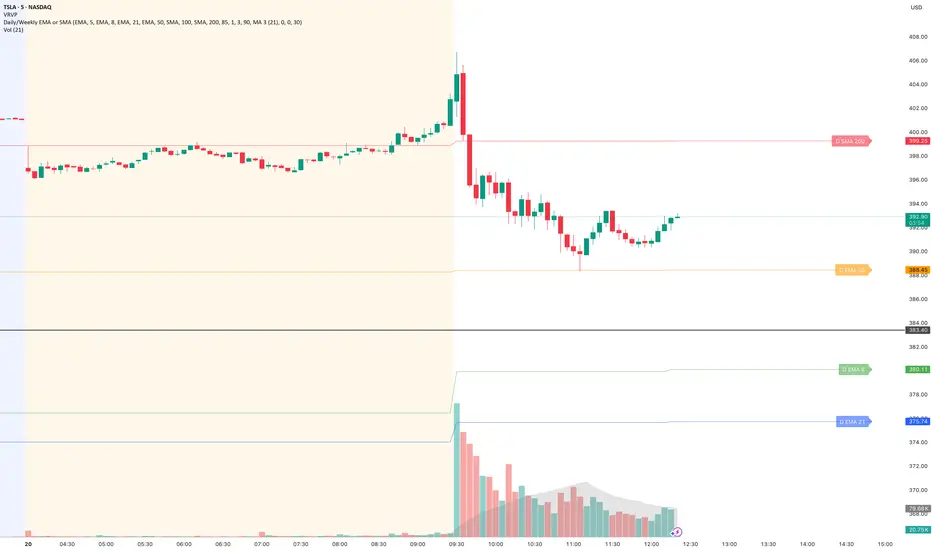
This indicator allows traders to view Daily and Weekly EMAs (Exponential Moving Averages) directly on lower timeframes such as 1m, 5m, 15m, or 1h charts — providing a higher timeframe perspective without switching charts.
The script includes individual checkboxes for each EMA length — 5, 8, 9, 21, 50, and 200 — organized into two clear sections:
🟢 Daily EMAs
🔵 Weekly EMAs
You can selectively enable or disable any EMA to match your trading style and reduce chart clutter.
Each EMA is color-coded for clarity and consistency:
5 EMA: Green
8 EMA: Blue
9 EMA: Blue
21 EMA: Orange
50 EMA: Purple
200 EMA: Red
Weekly EMAs appear slightly transparent to distinguish them from daily ones.
This makes it easy to visualize higher timeframe trend direction, confluence zones, and dynamic support/resistance levels while trading intraday.
💡 Key Features
The script includes individual checkboxes for each EMA length — 5, 8, 9, 21, 50, and 200 — organized into two clear sections:
🟢 Daily EMAs
🔵 Weekly EMAs
You can selectively enable or disable any EMA to match your trading style and reduce chart clutter.
Each EMA is color-coded for clarity and consistency:
5 EMA: Green
8 EMA: Blue
9 EMA: Blue
21 EMA: Orange
50 EMA: Purple
200 EMA: Red
Weekly EMAs appear slightly transparent to distinguish them from daily ones.
This makes it easy to visualize higher timeframe trend direction, confluence zones, and dynamic support/resistance levels while trading intraday.
💡 Key Features
- View Daily and Weekly EMAs on smaller timeframes.
- Individual checkbox toggles for all 6 EMA lengths.
- Separate sections for Daily and Weekly EMAs.
- Color-coded lines for easy visual recognition.
- Works seamlessly on any symbol or timeframe below Daily.
Note di rilascio
This indicator lets you overlay Daily & Weekly Moving Averages (SMA or EMA) on lower timeframe charts (1m, 5m, 15m, 1h, etc.), giving you higher timeframe context without switching charts.- Choose SMA or EMA globally for all lines.
- Input custom lengths (5 values) with dedicated colors: Green, Blue, Orange, Purple, Red.
- Toggle visibility per line, organized in two groups: Daily and Weekly.
- Weekly lines draw with transparency to distinguish from Daily.
Ideal for visualizing trend confluence, dynamic support/resistance, and HTF direction while trading intraday.
Note di rilascio
Date: October 2025Version: 2.5
🚀 New Features
Descriptive Value Labels:
Added dynamic right-edge labels showing each MA’s name and value (e.g., “Daily EMA 8: 153.16”).
Labels automatically update in real time and move slightly above each MA line for better visibility.
Real-Time Accuracy:
Daily and weekly EMAs/SMA values now use live forming candle data, matching TradingView’s built-in indicators exactly.
Compact One-Line Layout:
All label.new() and plot() statements are refactored into single-line, clean syntax for better readability and performance.
Improved Visual Hierarchy:
Daily lines use solid colors; Weekly lines are semi-transparent for distinction.
Labels are color-matched and slightly larger (size=normal) for readability.
🛠 Fixes & Improvements
Fixed previous issue where daily EMAs appeared stepped or lagging (now shows correct intraday value).
Fixed label overlap and alignment — labels now render just above their respective lines.
Consolidated redundant function calls for efficiency.
Enhanced color consistency across all MA lengths (5, 8, 21, 50, 200).
⚙️ Behavior Summary
Works on any lower timeframe (1m, 5m, 15m, etc.).
Supports global toggle between EMA and SMA.
Auto-updating higher-timeframe values (daily & weekly).
Color-coded and labeled for quick trend visualization.
Note di rilascio
Fixes label positioningNote di rilascio
Update titleNote di rilascio
What’s New- Labels now sit slightly above lines for clearer visibility.
- Restored color-coded design (green, blue, orange, purple, red) with white text.
- Fixed duplicate labels — now only one clean label per MA.
- Improved visual balance and adaptive spacing for all assets.
Note di rilascio
Adds ORB supportNote di rilascio
Fix: ORB line extension to 9:30 AM candle- ORB lines now start exactly at 09:30 New York time and extend rightward through the session.
- Implemented xloc=bar_time with computed t930 timestamp to anchor lines correctly across timeframes.
- Prevents early termination of ORB lines seen on intraday charts.
Note di rilascio
Switched 4H to WeeklyNote di rilascio
- Offset labels to right
Note di rilascio
Added 100 SMA/EMA to listNote di rilascio
- Hidden Daily MA 1 (5 EMA) by default — Changed showDaily1 from true to false
- Added Slope Coloring (off by default) — MA lines change color based on slope direction (rising = green, falling = red), with customizable colors
- Added MA Ribbon Fill (off by default) — Fills between consecutive daily MA plots (1-2, 2-3, 3-4, 4-5, 5-6), green when shorter MA is above longer, red when below, with adjustable transparency
- Added Price Distance % in Labels (off by default) — Appends (X.XX%) to each MA label showing how far current price is from that MA
- Added MA Confluence Zone Highlighting (off by default) — Highlights chart background when 3+ visible daily MAs cluster within a configurable threshold (default 1% of price), with customizable color/transparency and minimum MA count
- Added Bar Coloring (off by default) — Colors chart candles bullish/bearish based on whether price is above/below a user-selected daily MA (defaults to MA 3 / 21 EMA), with customizable bull/bear colors
Note di rilascio
Release Notes – Script Enhancements- Daily Moving Averages (MAs) are now hidden when the user selects the weekly interval
- Labels are automatically hidden when either daily or weekly intervals are selected
- Weekly Moving Averages (8, 21, 50, 100, 200) are automatically displayed when the weekly interval is selected
Note di rilascio
- Security fixes
- Label alignment
Note di rilascio
- Updates labels text size
Note di rilascio
Bug fixes- Weekly MA visibility respects your selections — Weekly MAs no longer force slots 2–6 on every weekly chart. On a weekly timeframe, each weekly MA now follows its own toggle, or mirrors the matching daily toggle when the weekly one is off (e.g. Daily MA 2 & 3 on → Weekly 2 & 3 show; Daily/Weekly MA 5 off → MA 5 stays hidden).
- Labels hidden on monthly and higher charts — “Hide labels on Daily+ chart timeframes” now applies to all non-intraday intervals (daily, weekly, monthly, and above), not just D and W. Labels and tail lines stay visible on intraday charts only.
Label & display (recent)
- Label style options — Choose “Text only” (minimal) or “Pill” (filled box).
- Label placement controls — Vertical offset in ticks, optional far-right placement, and separate tail extension vs. label padding bars.
- Tail line alignment — Tail lines extend to label anchors for cleaner alignment with MA values.
- MA line transparency — Adjustable opacity for daily MAs; weekly MAs render slightly fainter by default.
Settings renamed
“Hide labels on Daily / Weekly chart timeframe” → “Hide labels on Daily+ chart timeframes” — Reflects the expanded hide behavior on monthly+ charts.
Script open-source
Nello spirito di TradingView, l'autore di questo script lo ha reso open source, in modo che i trader possano esaminarne e verificarne la funzionalità. Complimenti all'autore! Sebbene sia possibile utilizzarlo gratuitamente, ricordiamo che la ripubblicazione del codice è soggetta al nostro Regolamento.

Declinazione di responsabilità
Le informazioni e le pubblicazioni non sono intese come, e non costituiscono, consulenza o raccomandazioni finanziarie, di investimento, di trading o di altro tipo fornite o approvate da TradingView. Per ulteriori informazioni, consultare i Termini di utilizzo.
Script open-source
Nello spirito di TradingView, l'autore di questo script lo ha reso open source, in modo che i trader possano esaminarne e verificarne la funzionalità. Complimenti all'autore! Sebbene sia possibile utilizzarlo gratuitamente, ricordiamo che la ripubblicazione del codice è soggetta al nostro Regolamento.
Declinazione di responsabilità
Le informazioni e le pubblicazioni non sono intese come, e non costituiscono, consulenza o raccomandazioni finanziarie, di investimento, di trading o di altro tipo fornite o approvate da TradingView. Per ulteriori informazioni, consultare i Termini di utilizzo.