Liquidity + HVP + Swing Projection + Low-Vol Range Breakouts
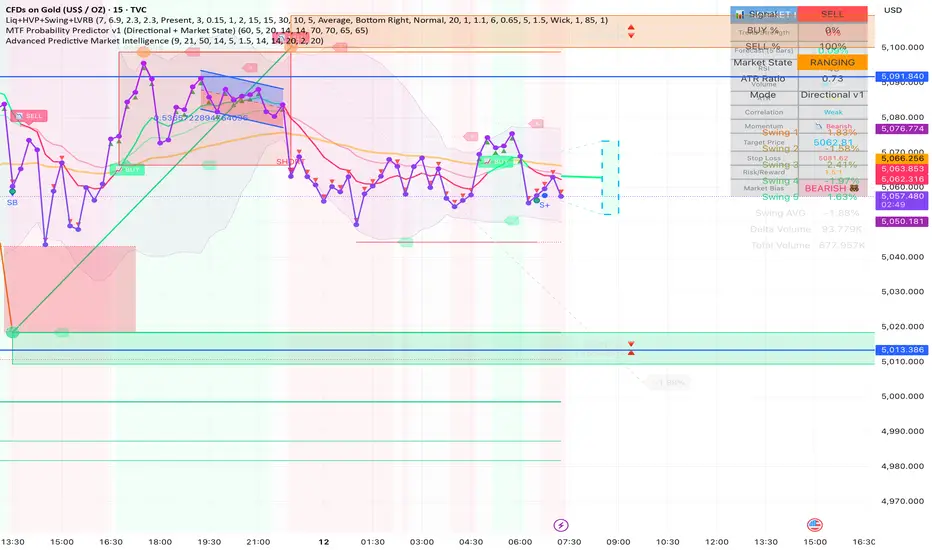
Buyside & Sellside Liquidity: Detects levels where price has pivoted multiple times and draws zones.
Touch & Reject: It doesn't just mark levels; it alerts you when the price enters a zone and provides a "Reject" (RJ) signal if the price hits the zone and closes back outside of it (potential reversal).
Liquidity Voids: Optionally highlights price gaps where liquidity is thin, suggesting the market might return to "fill" those areas.
Institutional Activity: It identifies significant Pivot Highs/Lows that occurred on unusually high volume.
Visual Levels: It marks these points with circles and labels. Large volume spikes at pivots often act as strong support or resistance levels in the future.
Historical Analysis: It measures the percentage move of the last few price swings.
Future Projection: Based on the average (or median) of previous swings, it projects a dashed line to a target price for the current move.
Stats Dashboard: A table in the corner of your chart displays the volume delta (buy vs. sell volume) and the percentage changes of recent swings.
The Squeeze: It looks for a sequence of candles with very small bodies and low Average True Range (ATR). This represents a market in "equilibrium" or consolidation.
The Breakout: When the price finally breaks out of this tight, low-volatility box with a strong candle, it triggers a LONG or SHORT signal.
Touch & Reject: It doesn't just mark levels; it alerts you when the price enters a zone and provides a "Reject" (RJ) signal if the price hits the zone and closes back outside of it (potential reversal).
Liquidity Voids: Optionally highlights price gaps where liquidity is thin, suggesting the market might return to "fill" those areas.
Institutional Activity: It identifies significant Pivot Highs/Lows that occurred on unusually high volume.
Visual Levels: It marks these points with circles and labels. Large volume spikes at pivots often act as strong support or resistance levels in the future.
Historical Analysis: It measures the percentage move of the last few price swings.
Future Projection: Based on the average (or median) of previous swings, it projects a dashed line to a target price for the current move.
Stats Dashboard: A table in the corner of your chart displays the volume delta (buy vs. sell volume) and the percentage changes of recent swings.
The Squeeze: It looks for a sequence of candles with very small bodies and low Average True Range (ATR). This represents a market in "equilibrium" or consolidation.
The Breakout: When the price finally breaks out of this tight, low-volatility box with a strong candle, it triggers a LONG or SHORT signal.

Declinazione di responsabilità
Le informazioni e le pubblicazioni non sono intese come, e non costituiscono, consulenza o raccomandazioni finanziarie, di investimento, di trading o di altro tipo fornite o approvate da TradingView. Per ulteriori informazioni, consultare i Termini di utilizzo.
Declinazione di responsabilità
Le informazioni e le pubblicazioni non sono intese come, e non costituiscono, consulenza o raccomandazioni finanziarie, di investimento, di trading o di altro tipo fornite o approvate da TradingView. Per ulteriori informazioni, consultare i Termini di utilizzo.