OPEN-SOURCE SCRIPT
NL LBR 3-10 Oscillator
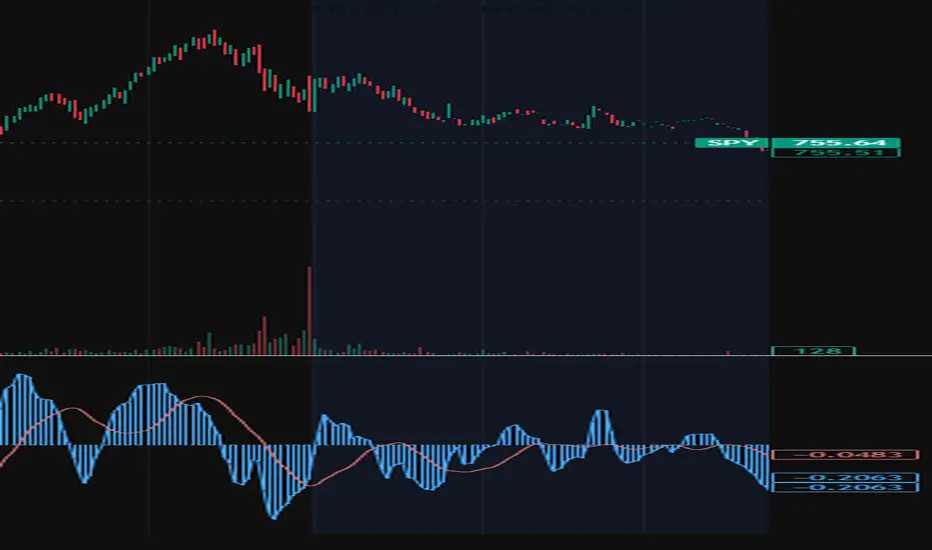
LBR 3-10 Oscillator with Divergence & Convergence
The LBR 3-10 Oscillator is a momentum indicator developed by Linda Bradford Raschke. It measures the difference between a 3-period and 10-period moving average, smoothed by a 16-period signal line — functionally similar to MACD but tuned for shorter-term momentum cycles. It is particularly effective for identifying trend direction, pullback entries, and momentum exhaustion.
Oscillator
Fast MA (default 3) minus Slow MA (default 10), plotted as both a line and histogram
Signal line smoothing (default 16) displayed as an overlay
Optional volatility normalization via ATR to compare momentum across instruments and timeframes
Optional standard deviation bands to identify statistically extended readings
Choice of SMA or EMA for both the oscillator and signal line
Divergence & Convergence
Lines are drawn directly on the oscillator pane connecting MACD pivot points — no cluttered price chart markings.
🟢 Bullish Divergence (solid green) — Price makes a lower low while the oscillator makes a higher low. Classic reversal signal indicating selling momentum is fading.
🔴 Bearish Divergence (solid red) — Price makes a higher high while the oscillator makes a lower high. Momentum is fading into the new high, warning of a potential reversal.
🟢 Bullish Convergence (dashed green) — Price makes a higher low while the oscillator makes a lower low. Hidden bullish signal confirming trend continuation to the upside.
🔴 Bearish Convergence (dashed red) — Price makes a lower high while the oscillator makes a higher high. Hidden bearish signal confirming trend continuation to the downside.
Each divergence and convergence type can be toggled on or off independently. Pivot lookback is fully adjustable to control signal sensitivity.
Alerts
All signals support TradingView alerts:
Trend change up / down
Pullback in uptrend / downtrend
First cross in uptrend / downtrend
Bullish / Bearish Divergence
Bullish / Bearish Convergence
The LBR 3-10 Oscillator is a momentum indicator developed by Linda Bradford Raschke. It measures the difference between a 3-period and 10-period moving average, smoothed by a 16-period signal line — functionally similar to MACD but tuned for shorter-term momentum cycles. It is particularly effective for identifying trend direction, pullback entries, and momentum exhaustion.
Oscillator
Fast MA (default 3) minus Slow MA (default 10), plotted as both a line and histogram
Signal line smoothing (default 16) displayed as an overlay
Optional volatility normalization via ATR to compare momentum across instruments and timeframes
Optional standard deviation bands to identify statistically extended readings
Choice of SMA or EMA for both the oscillator and signal line
Divergence & Convergence
Lines are drawn directly on the oscillator pane connecting MACD pivot points — no cluttered price chart markings.
🟢 Bullish Divergence (solid green) — Price makes a lower low while the oscillator makes a higher low. Classic reversal signal indicating selling momentum is fading.
🔴 Bearish Divergence (solid red) — Price makes a higher high while the oscillator makes a lower high. Momentum is fading into the new high, warning of a potential reversal.
🟢 Bullish Convergence (dashed green) — Price makes a higher low while the oscillator makes a lower low. Hidden bullish signal confirming trend continuation to the upside.
🔴 Bearish Convergence (dashed red) — Price makes a lower high while the oscillator makes a higher high. Hidden bearish signal confirming trend continuation to the downside.
Each divergence and convergence type can be toggled on or off independently. Pivot lookback is fully adjustable to control signal sensitivity.
Alerts
All signals support TradingView alerts:
Trend change up / down
Pullback in uptrend / downtrend
First cross in uptrend / downtrend
Bullish / Bearish Divergence
Bullish / Bearish Convergence
Script open-source
Nello spirito di TradingView, l'autore di questo script lo ha reso open source, in modo che i trader possano esaminarne e verificarne la funzionalità. Complimenti all'autore! Sebbene sia possibile utilizzarlo gratuitamente, ricordiamo che la ripubblicazione del codice è soggetta al nostro Regolamento.

Declinazione di responsabilità
Le informazioni e le pubblicazioni non sono intese come, e non costituiscono, consulenza o raccomandazioni finanziarie, di investimento, di trading o di altro tipo fornite o approvate da TradingView. Per ulteriori informazioni, consultare i Termini di utilizzo.
Script open-source
Nello spirito di TradingView, l'autore di questo script lo ha reso open source, in modo che i trader possano esaminarne e verificarne la funzionalità. Complimenti all'autore! Sebbene sia possibile utilizzarlo gratuitamente, ricordiamo che la ripubblicazione del codice è soggetta al nostro Regolamento.
Declinazione di responsabilità
Le informazioni e le pubblicazioni non sono intese come, e non costituiscono, consulenza o raccomandazioni finanziarie, di investimento, di trading o di altro tipo fornite o approvate da TradingView. Per ulteriori informazioni, consultare i Termini di utilizzo.