Aggiornato
Sector Rotation Dashboard v1
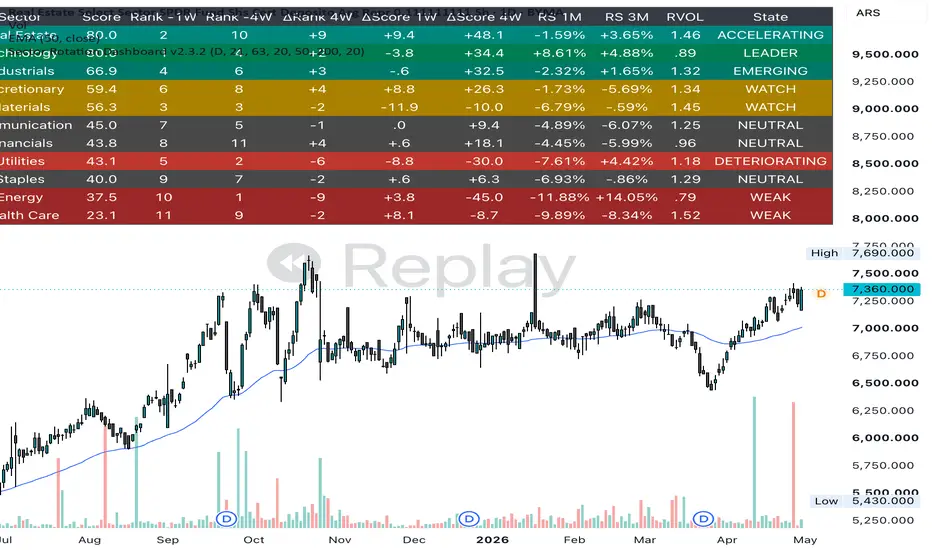
The Sector Rotation Dashboard is a market-ranking tool designed to show which major U.S. equity sectors are currently demonstrating the strongest relative strength and momentum versus the broader market.
It compares the 11 major sector ETFs—such as Technology, Energy, Financials, Health Care, Industrials and others—against SPY as the broad-market benchmark. Each sector receives a score based on a combination of short- and medium-term relative strength, absolute momentum, trend quality, trading volume, and recent acceleration. The sectors are then ranked from strongest to weakest.
In isolation, the dashboard is best used as a top-down screening tool, not as a standalone trade signal. Its purpose is to answer:
Which parts of the market are attracting leadership right now, and which sectors are weakening?
A high-ranking sector with strong positive relative strength versus SPY is showing market leadership. A sector moving rapidly up the rankings may be entering an emerging leadership phase. Conversely, a sector falling down the table or showing negative relative strength is losing momentum versus the broader market.
The most useful columns are:
- Rank — where the sector currently sits versus the other 10 sectors.
- Score — the combined strength score; higher means stronger overall technical leadership.
- RS 1M — approximately one-month performance relative to SPY.
- RS 3M — approximately three-month performance relative to SPY.
- RVOL — current volume relative to its normal volume.
- State — a simplified classification such as LEADER, WATCH, NEUTRAL, or WEAK.
The strongest situation is generally when several factors agree: the sector is near the top of the ranking, its score is high, both short- and medium-term relative strength are positive, and the ranking is improving rather than deteriorating.
For example, if Energy is ranked #1, has a score above 70, positive 1-month and 3-month relative strength versus SPY, and is maintaining or improving its rank, the dashboard is indicating that Energy is currently one of the strongest areas of the market. That does not mean every energy stock will outperform, but it identifies the sector as a logical area for further research.
A practical way to use the dashboard on its own is to review it once a week and focus attention on:
- sectors ranked near the top,
- sectors moving quickly upward,
- sectors transitioning from WATCH toward LEADER,
- and sectors where short-term strength is beginning to confirm longer-term strength.
The dashboard is therefore best thought of as a market map. It narrows the universe from thousands of stocks down to a handful of sectors where leadership is currently concentrated. From there, a user can choose to investigate industry groups or individual companies within those sectors.
Its main limitation is that it is primarily a confirmation tool. Because relative strength and momentum need time to develop, it may identify a sector after the initial breakout has already started. That is why the later industry- and stock-level breakout tools are useful companions, but the Sector Rotation Dashboard can still be used effectively by itself as a weekly market-leadership screen.
This is general information only and not financial advice. For personal guidance, please talk to a licensed professional.
This is the first indicator I've created so go easy on me!! The next one I'm working on hopes to identify which industries within sectors are driving the broader index to increase (or decrease).
It compares the 11 major sector ETFs—such as Technology, Energy, Financials, Health Care, Industrials and others—against SPY as the broad-market benchmark. Each sector receives a score based on a combination of short- and medium-term relative strength, absolute momentum, trend quality, trading volume, and recent acceleration. The sectors are then ranked from strongest to weakest.
In isolation, the dashboard is best used as a top-down screening tool, not as a standalone trade signal. Its purpose is to answer:
Which parts of the market are attracting leadership right now, and which sectors are weakening?
A high-ranking sector with strong positive relative strength versus SPY is showing market leadership. A sector moving rapidly up the rankings may be entering an emerging leadership phase. Conversely, a sector falling down the table or showing negative relative strength is losing momentum versus the broader market.
The most useful columns are:
- Rank — where the sector currently sits versus the other 10 sectors.
- Score — the combined strength score; higher means stronger overall technical leadership.
- RS 1M — approximately one-month performance relative to SPY.
- RS 3M — approximately three-month performance relative to SPY.
- RVOL — current volume relative to its normal volume.
- State — a simplified classification such as LEADER, WATCH, NEUTRAL, or WEAK.
The strongest situation is generally when several factors agree: the sector is near the top of the ranking, its score is high, both short- and medium-term relative strength are positive, and the ranking is improving rather than deteriorating.
For example, if Energy is ranked #1, has a score above 70, positive 1-month and 3-month relative strength versus SPY, and is maintaining or improving its rank, the dashboard is indicating that Energy is currently one of the strongest areas of the market. That does not mean every energy stock will outperform, but it identifies the sector as a logical area for further research.
A practical way to use the dashboard on its own is to review it once a week and focus attention on:
- sectors ranked near the top,
- sectors moving quickly upward,
- sectors transitioning from WATCH toward LEADER,
- and sectors where short-term strength is beginning to confirm longer-term strength.
The dashboard is therefore best thought of as a market map. It narrows the universe from thousands of stocks down to a handful of sectors where leadership is currently concentrated. From there, a user can choose to investigate industry groups or individual companies within those sectors.
Its main limitation is that it is primarily a confirmation tool. Because relative strength and momentum need time to develop, it may identify a sector after the initial breakout has already started. That is why the later industry- and stock-level breakout tools are useful companions, but the Sector Rotation Dashboard can still be used effectively by itself as a weekly market-leadership screen.
This is general information only and not financial advice. For personal guidance, please talk to a licensed professional.
This is the first indicator I've created so go easy on me!! The next one I'm working on hopes to identify which industries within sectors are driving the broader index to increase (or decrease).
Note di rilascio
Sector Rotation Dashboard v2.3 evolved from v1 by adding historical rank/score tracking, 1W and 4W change metrics, and a richer state engine beyond the original LEADER/WATCH/NEUTRAL/WEAK labels. It also introduced ACCELERATING, EMERGING, EARLY ROTATION, and DETERIORATING states to better capture improving sectors earlier and flag fading leadership before absolute scores fully break down.This dashboard is designed to be used in conjunction with the Industry Rotation Dashboard v5.2 and the Early Rotation & Breakout Dashboard v3.4. The latter 2 take up a large portion of the screen, so are best used in a dedicated separate window to your charts.
Sector Rotation Dashboard v2.3
This dashboard is designed to be used in conjunction with the Industry Rotation Dashboard v5.2 and the help you see where relative strength is moving across the major US equity sectors.
It ranks the 11 Select Sector SPDR ETFs using a mix of:
- Relative strength vs SPY
- Short- and medium-term momentum
- Trend structure
- Relative volume
- Relative-strength acceleration
The idea is simple: instead of looking at sectors one by one, the dashboard gives you a quick view of which areas of the market are strengthening, fading, or beginning to rotate.
The current sector states are:
ACCELERATING
Strong score, strong rank, and improving momentum.
EMERGING
A sector that is improving meaningfully and moving up the rankings.
LEADER
A high-scoring sector with established strength.
EARLY ROTATION
A lower-scoring sector that is improving quickly and may be starting to rotate into strength.
WATCH
Constructive, but not yet strong enough to qualify as a leader.
NEUTRAL
Middle-of-the-pack behavior.
DETERIORATING
A sector that may still have a reasonable absolute score, but whose rank and/or score are weakening.
WEAK
Low relative strength and weak overall conditions.
The table also shows current rank, rank one week ago, rank four weeks ago, score changes, relative strength over 1 month and 3 months, and relative volume.
I mainly use this as the first step in a top-down workflow:
Market → Sector → Industry → Stock
It is not meant to predict market tops or bottoms. It is a rotation and relative-strength tool designed to help identify where leadership is developing and where it may be fading.
I plan to keep this script free.
If you spot strange behavior, unusual transitions, or anything that looks inconsistent in live use, feel free to leave feedback.
This is general information only and not financial advice. For personal guidance, please talk to a licensed professional.

Declinazione di responsabilità
Le informazioni e le pubblicazioni non sono intese come, e non costituiscono, consulenza o raccomandazioni finanziarie, di investimento, di trading o di altro tipo fornite o approvate da TradingView. Per ulteriori informazioni, consultare i Termini di utilizzo.
Declinazione di responsabilità
Le informazioni e le pubblicazioni non sono intese come, e non costituiscono, consulenza o raccomandazioni finanziarie, di investimento, di trading o di altro tipo fornite o approvate da TradingView. Per ulteriori informazioni, consultare i Termini di utilizzo.