OPEN-SOURCE SCRIPT
PrismFlow Session Momentum Matrix
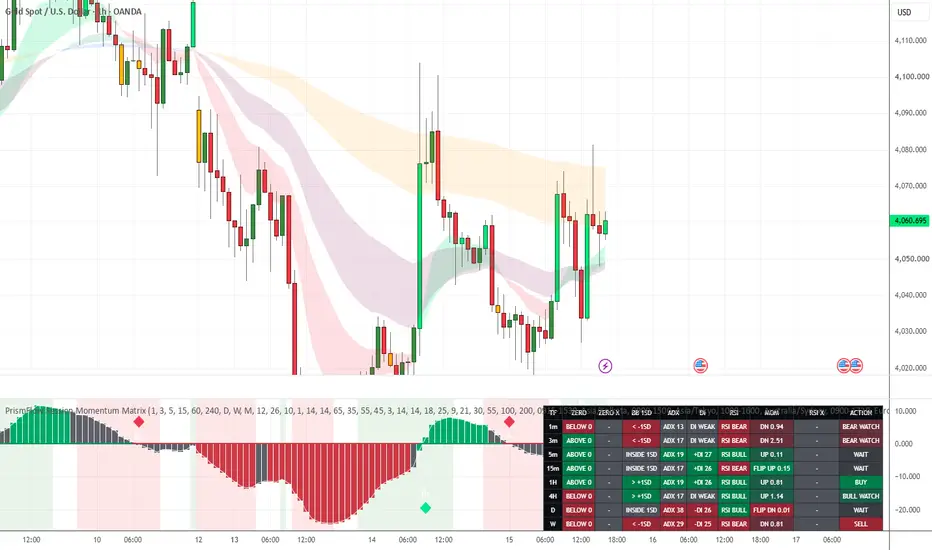
`PrismFlow Session Momentum Matrix` is a multi-timeframe momentum and session-awareness indicator designed to help traders read market direction, momentum strength, and fresh signal timing in one compact view.
It combines AK MACD-style momentum, MACD Bollinger Band expansion, zero-line crosses, ADX/DI trend confirmation, RSI behaviour, EMA trend zones, global session lines, and Opening Range Boxes.
The aim is not to give a blind buy/sell button, but to help traders answer three practical questions:
1. Is momentum bullish or bearish?
2. Is the move fresh or already extended?
3. Which timeframe currently gives the cleanest decision context?
**Main Features**
- Multi-timeframe status board
- MACD zero-line above/below status
- Fresh zero-cross diamond signals
- MACD outside/inside 1 standard deviation band
- ADX and DI trend-strength filter
- RSI confirmation and RSI candle colouring
- Momentum flip/separation reading
- Suggested timeframe/action row
- EMA stacked trend zones on the main chart
- Global market session lines
- Opening Range Boxes for India, Tokyo, Sydney, Frankfurt, London, and New York
- Chart timezone reminder for selected market
**Diamond Signals**
The diamonds show fresh AK MACD zero-line crosses.
A green `0+` diamond means MACD has crossed upward through zero. This is an early bullish momentum shift.
A red `0-` diamond means MACD has crossed downward through zero. This is an early bearish momentum shift.
These diamonds are best used as attention signals. A diamond is stronger when it agrees with the panel, ADX/DI, RSI, and higher-timeframe direction.
**RSI Candle Colours**
The indicator can colour candles when RSI crosses important levels.
A lime candle appears when RSI crosses upward through the bullish level, currently set around `55`.
An amber candle appears when RSI crosses downward through the bearish level, currently set around `45`.
These candles help show when price momentum is improving or weakening directly on the chart.
Their relevance:
- Lime RSI candle: buyers are gaining momentum
- Amber RSI candle: sellers are gaining momentum
- Best used with MACD zero-cross diamonds and EMA zones
- More reliable when the panel also shows bullish or bearish alignment
In the panel, RSI is used as confirmation. If RSI is bullish, it supports buy setups. If RSI is bearish, it supports sell setups. RSI alone is not the full trade signal; it is one part of the decision stack.
**EMA Stacked Zones**
The main chart shows EMA fill zones instead of cluttered EMA lines.
The zones are built from:
- EMA `9/21`: fast trend zone
- EMA `30/55`: medium trend zone
- EMA `100/200`: slow trend zone
When faster EMAs are above slower EMAs, the zone fills bullish. When faster EMAs are below slower EMAs, the zone fills bearish.
This gives a visual cue for trend stacking:
- All zones bullish: stronger bullish environment
- All zones bearish: stronger bearish environment
- Mixed zones: transition, chop, or uncertainty
- Price above bullish stacked zones: trend continuation is cleaner
- Price fighting inside mixed zones: avoid weak trades or wait for confirmation
The EMA fills are designed to give context without adding too many lines to the chart.
**How To Use The Panel**
The panel reads multiple timeframes and shows whether each one is bullish, bearish, fresh, expanding, or waiting.
Key columns:
`ZERO` shows whether MACD is above or below zero.
`ZERO X` shows fresh zero-line crosses.
`BB 1SD` shows whether MACD is outside the 1 standard deviation band. Outside the band suggests momentum expansion.
`ADX` shows trend strength.
`DI` shows whether buyers or sellers are leading.
`RSI` confirms bullish or bearish pressure.
`MOM` shows momentum flip or separation strength.
`ACTION` converts the conditions into simple guidance such as `FRESH BUY`, `BUY`, `FRESH SELL`, `SELL`, `WATCH`, or `WAIT`.
The bottom row suggests which timeframe currently has the cleanest trade context.
**Simple Decision Guide**
For a stronger buy setup, look for:
- Higher timeframes are bullish
- MACD is above zero
- A fresh green `0+` diamond appears
- BB CANDLE is above `+1SD`
- ADX confirms trend strength
- `+DI` is stronger than `-DI`
- RSI supports bullish pressure
- EMA zones are stacked bullish
- Price is respecting the session or ORB structure
For a stronger sell setup, look for:
- Higher timeframes are bearish
- MACD is below zero
- A fresh red `0-` diamond appears
- BB CANDLE is below `-1SD`
- ADX confirms trend strength
- `-DI` is stronger than `+DI`
- RSI supports bearish pressure
- EMA zones are stacked bearish
- Price is respecting the session or ORB structure
If signals are mixed, the better decision is usually to wait.
**Sessions And ORB**
The indicator includes session lines and Opening Range Boxes for commonly watched global markets:
- India NSE
- Asia Tokyo
- Australia Sydney
- Europe Frankfurt
- UK London
- US New York
Session start lines are solid. Session end lines are dashed. ORB boxes show the opening range for the selected market session.
This helps traders see where early session highs and lows form, and whether price is breaking out, rejecting, or consolidating around that range.
**Important Disclaimer**
This indicator is a decision-support tool. It has been constructed using AI and cognitive intelligence. It does not guarantee profits and should not be used as a standalone trading system. Always use risk management, stop losses, position sizing, and your own market judgment before entering any trade.
It combines AK MACD-style momentum, MACD Bollinger Band expansion, zero-line crosses, ADX/DI trend confirmation, RSI behaviour, EMA trend zones, global session lines, and Opening Range Boxes.
The aim is not to give a blind buy/sell button, but to help traders answer three practical questions:
1. Is momentum bullish or bearish?
2. Is the move fresh or already extended?
3. Which timeframe currently gives the cleanest decision context?
**Main Features**
- Multi-timeframe status board
- MACD zero-line above/below status
- Fresh zero-cross diamond signals
- MACD outside/inside 1 standard deviation band
- ADX and DI trend-strength filter
- RSI confirmation and RSI candle colouring
- Momentum flip/separation reading
- Suggested timeframe/action row
- EMA stacked trend zones on the main chart
- Global market session lines
- Opening Range Boxes for India, Tokyo, Sydney, Frankfurt, London, and New York
- Chart timezone reminder for selected market
**Diamond Signals**
The diamonds show fresh AK MACD zero-line crosses.
A green `0+` diamond means MACD has crossed upward through zero. This is an early bullish momentum shift.
A red `0-` diamond means MACD has crossed downward through zero. This is an early bearish momentum shift.
These diamonds are best used as attention signals. A diamond is stronger when it agrees with the panel, ADX/DI, RSI, and higher-timeframe direction.
**RSI Candle Colours**
The indicator can colour candles when RSI crosses important levels.
A lime candle appears when RSI crosses upward through the bullish level, currently set around `55`.
An amber candle appears when RSI crosses downward through the bearish level, currently set around `45`.
These candles help show when price momentum is improving or weakening directly on the chart.
Their relevance:
- Lime RSI candle: buyers are gaining momentum
- Amber RSI candle: sellers are gaining momentum
- Best used with MACD zero-cross diamonds and EMA zones
- More reliable when the panel also shows bullish or bearish alignment
In the panel, RSI is used as confirmation. If RSI is bullish, it supports buy setups. If RSI is bearish, it supports sell setups. RSI alone is not the full trade signal; it is one part of the decision stack.
**EMA Stacked Zones**
The main chart shows EMA fill zones instead of cluttered EMA lines.
The zones are built from:
- EMA `9/21`: fast trend zone
- EMA `30/55`: medium trend zone
- EMA `100/200`: slow trend zone
When faster EMAs are above slower EMAs, the zone fills bullish. When faster EMAs are below slower EMAs, the zone fills bearish.
This gives a visual cue for trend stacking:
- All zones bullish: stronger bullish environment
- All zones bearish: stronger bearish environment
- Mixed zones: transition, chop, or uncertainty
- Price above bullish stacked zones: trend continuation is cleaner
- Price fighting inside mixed zones: avoid weak trades or wait for confirmation
The EMA fills are designed to give context without adding too many lines to the chart.
**How To Use The Panel**
The panel reads multiple timeframes and shows whether each one is bullish, bearish, fresh, expanding, or waiting.
Key columns:
`ZERO` shows whether MACD is above or below zero.
`ZERO X` shows fresh zero-line crosses.
`BB 1SD` shows whether MACD is outside the 1 standard deviation band. Outside the band suggests momentum expansion.
`ADX` shows trend strength.
`DI` shows whether buyers or sellers are leading.
`RSI` confirms bullish or bearish pressure.
`MOM` shows momentum flip or separation strength.
`ACTION` converts the conditions into simple guidance such as `FRESH BUY`, `BUY`, `FRESH SELL`, `SELL`, `WATCH`, or `WAIT`.
The bottom row suggests which timeframe currently has the cleanest trade context.
**Simple Decision Guide**
For a stronger buy setup, look for:
- Higher timeframes are bullish
- MACD is above zero
- A fresh green `0+` diamond appears
- BB CANDLE is above `+1SD`
- ADX confirms trend strength
- `+DI` is stronger than `-DI`
- RSI supports bullish pressure
- EMA zones are stacked bullish
- Price is respecting the session or ORB structure
For a stronger sell setup, look for:
- Higher timeframes are bearish
- MACD is below zero
- A fresh red `0-` diamond appears
- BB CANDLE is below `-1SD`
- ADX confirms trend strength
- `-DI` is stronger than `+DI`
- RSI supports bearish pressure
- EMA zones are stacked bearish
- Price is respecting the session or ORB structure
If signals are mixed, the better decision is usually to wait.
**Sessions And ORB**
The indicator includes session lines and Opening Range Boxes for commonly watched global markets:
- India NSE
- Asia Tokyo
- Australia Sydney
- Europe Frankfurt
- UK London
- US New York
Session start lines are solid. Session end lines are dashed. ORB boxes show the opening range for the selected market session.
This helps traders see where early session highs and lows form, and whether price is breaking out, rejecting, or consolidating around that range.
**Important Disclaimer**
This indicator is a decision-support tool. It has been constructed using AI and cognitive intelligence. It does not guarantee profits and should not be used as a standalone trading system. Always use risk management, stop losses, position sizing, and your own market judgment before entering any trade.
Script open-source
Nello spirito di TradingView, l'autore di questo script lo ha reso open source, in modo che i trader possano esaminarne e verificarne la funzionalità. Complimenti all'autore! Sebbene sia possibile utilizzarlo gratuitamente, ricordiamo che la ripubblicazione del codice è soggetta al nostro Regolamento.

Declinazione di responsabilità
Le informazioni e le pubblicazioni non sono intese come, e non costituiscono, consulenza o raccomandazioni finanziarie, di investimento, di trading o di altro tipo fornite o approvate da TradingView. Per ulteriori informazioni, consultare i Termini di utilizzo.
Script open-source
Nello spirito di TradingView, l'autore di questo script lo ha reso open source, in modo che i trader possano esaminarne e verificarne la funzionalità. Complimenti all'autore! Sebbene sia possibile utilizzarlo gratuitamente, ricordiamo che la ripubblicazione del codice è soggetta al nostro Regolamento.
Declinazione di responsabilità
Le informazioni e le pubblicazioni non sono intese come, e non costituiscono, consulenza o raccomandazioni finanziarie, di investimento, di trading o di altro tipo fornite o approvate da TradingView. Per ulteriori informazioni, consultare i Termini di utilizzo.