Royalty Trend + CISD Dashboard
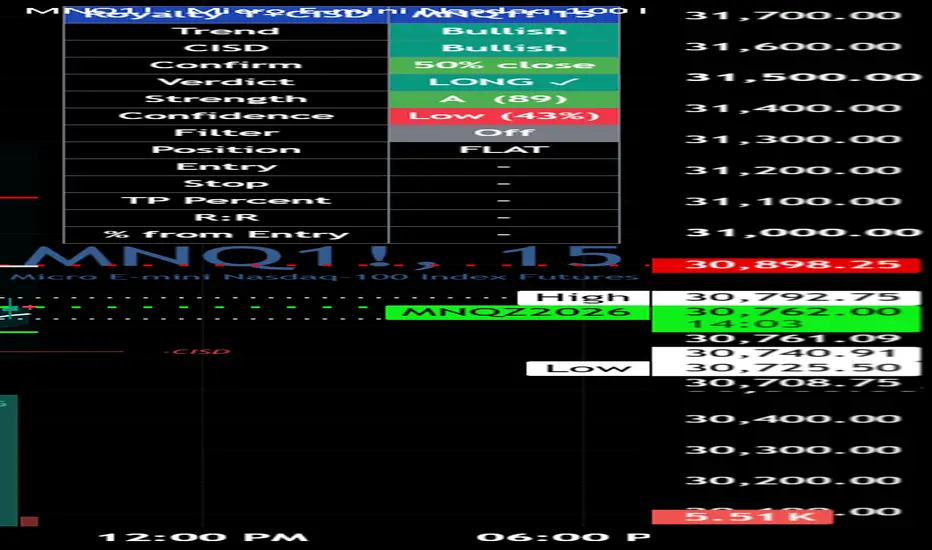
ROYALTY TREND + CISD DASHBOARD
A confluence indicator that combines an ATR-based trend engine with Change in State of Delivery (CISD) detection. A trade signal ("GO") prints only when both agree. Each signal is then graded for setup quality and trustworthiness, and an outcome log tests those signals forward on your chart's history so you can see which grades and exit styles actually performed.
The idea is simple: the trend flip is the TRIGGER, the CISD is the CONFIRMATION, and the verdict is the CONFLUENCE.
━━━━━━━━━━━━━━━━━━━━━━━━━━━━━━━━━━━━━━━
CREDITS
━━━━━━━━━━━━━━━━━━━━━━━━━━━━━━━━━━━━━━━
This indicator is built on two open-source scripts. Full credit to their authors:
- "Trend Signals with TP & SL" by UAlgo
Supplies the ATR trend engine, Buy/Sell signals, cloud, and the Entry/SL/TP framework. Originally Pine v5; migrated to v6 here.
- "CISD with Alerts" by neo|
Supplies the CISD structure-tracking engine and level drawing.
Thank you to both authors for sharing their work with the community. Everything beyond those two cores was added in this script: the confirmation gate, confluence logic, Strength and Confidence scoring, signal filter, outcome log, model-compare table, repaint controls, consolidated alert, and dashboard themes.
━━━━━━━━━━━━━━━━━━━━━━━━━━━━━━━━━━━━━━━
HOW IT WORKS
━━━━━━━━━━━━━━━━━━━━━━━━━━━━━━━━━━━━━━━
1) TREND ENGINE (from UAlgo)
An ATR band (source hl2, Sensitivity x ATR) trails price. When the close crosses the opposite band, the trend flips and a Buy or Sell label prints. A cloud built from the EMA of highs and the EMA of lows sits behind price. The cloud is tinted aqua when the MACD line is above zero and red when it is below.
On a trend flip, the script projects an Entry, Stop, and TP1/TP2/TP3. You can choose between two modes:
- Percent: the stop sits at Stop Loss % from entry, and the TPs sit at 1R, 2R, and 3R. Setting the percent to 0 turns levels off.
- ATR: the stop and the TPs are fixed ATR multiples, captured at the entry bar.
The trend position closes when the stop or TP3 is hit. Levels are drawn from the last trend-flip entry.
2) CISD ENGINE (from neo|)
The script tracks the opening price of pullback candle sequences. When market structure breaks, it draws a CISD level at the origin of the move that caused the break. A CISD becomes CONFIRMED when price closes through that level in one of two ways:
- Strong close: a single candle closes beyond the level, in the strong part of its own range (default: the top or bottom 50%), or
- 2-bar: two consecutive closes beyond the level (optional).
The confirmation candle is labeled "50% close" or "2-bar" and its background is highlighted. CISD state is tri-state: Bullish, Bearish, or None.
3) CONFLUENCE / GO SIGNALS
- GO LONG prints when the trend is bullish AND the CISD is bullish.
- GO SHORT prints when the trend is bearish AND the CISD is bearish.
- Only the first bar of a new alignment prints a marker.
- If the two disagree, the dashboard verdict reads CONFLICT.
4) STRENGTH SCORE (0-100, graded A+ to F)
This measures setup quality on the chart timeframe. Points come from:
- Alignment: 40 points (12 if there is no CISD yet)
- CISD confirmation quality: 20 for a strong close, 12 for 2-bar
- MACD momentum direction and slope: 15
- Close position versus the cloud: 10
- R:R to TP1: 10
- Freshness of the CISD (bars since it formed): 5
Grades: A+ is 90 or more, A is 80+, B is 70+, C is 60+, D is 50+, and anything lower is F.
5) CONFIDENCE SCORE (0-100: High, Med, or Low)
This measures how much to trust the read. Points come from:
- Higher-timeframe trend agreement: 40 (the default HTF is 60m)
- Trend persistence (bars since the last flip, and number of flips in the last 20 bars): 25
- Volatility regime (ATR14 versus its 50-bar average; calm conditions score higher): 20
- Extension from the cloud midpoint, measured in ATR (stretched price scores lower): 15
Tiers: High is 75 or more, Med is 50+, and anything lower is Low.
6) SIGNAL FILTER
Filter modes: Off, Strength only, Confidence only, Both required, or Either. You set a minimum grade and a minimum confidence %. GO signals that fail the filter print a small gray "×" so you can still see what was blocked.
7) OUTCOME LOG (expectancy table)
Every raw GO signal is logged before the filter is applied. Each one is entered at the GO bar's close and simulated forward on confirmed bars only. You choose one of three exit models:
- Scale thirds: take 1/3 at TP1 and move the stop to breakeven, take 1/3 at TP2 and move the stop to TP1, take the final 1/3 at TP3.
- All out at TP1: a single 1R target.
- Runner to TP3: full size held to TP3 or the stop, with a fixed stop.
The table reports N, Expectancy (average R per trade), and Win%. Results are shown overall, by Strength grade, and by Confidence tier. This is how you find out whether A grades actually outperform C grades on your instrument.
8) MODEL-COMPARE TABLE
All three exit models are run in parallel on the same signals. For each model the table shows N, Expectancy, Net R, Max Drawdown (in R), and Profit Factor. The row for your currently selected model is marked.
9) REPAINT CONTROL
- "Confirm signals on bar close" (on by default): Buy/Sell, GO, blocked markers, and CISD confirmation marks only appear after the bar closes.
- "HTF confidence: use last closed HTF bar" (on by default): the HTF component won't wiggle intrabar, at the cost of up to one HTF bar of lag.
The outcome log and the compare table always use confirmed bars only.
10) DASHBOARD
The dashboard shows Trend, CISD, Confirm method, Verdict, Strength, Confidence, Filter status, Position, Entry, Stop, TPs, R:R, and % from entry. There are two themes: Classic, and Futuristic (HUD), which uses a monospace font, a neon palette, and segmented meters.
━━━━━━━━━━━━━━━━━━━━━━━━━━━━━━━━━━━━━━━
HOW TO USE IT
━━━━━━━━━━━━━━━━━━━━━━━━━━━━━━━━━━━━━━━
1. Set the HTF. Under Confidence, set the higher timeframe above your execution chart (for example, 60 on a 5m chart, or 240 on a 15m or 1H chart).
2. Choose your risk model. Use Percent for clean R-multiples. Use ATR if you want stops that adapt to volatility.
3. Read the log before filtering. With the filter Off, scroll through plenty of history and study the Outcome Log and the Compare table. Look for which grades and confidence tiers show positive expectancy, and which exit model gives the best balance of Net R and Max Drawdown.
4. Set the filter to match the data. For example, if C-grade signals are negative but B and above are positive, set the Min grade to B. Choose the exit model that fits both the numbers and how you actually manage trades.
5. Trade the GO, not just the flip.
• Buy/Sell labels mean only that the trend has flipped.
• GO means the trend and the CISD agree.
• Prioritize GO signals that pass the filter and carry a High Confidence rating.
6. Set up alerts.
• Recommended: create an alert on this indicator with the condition "Any alert() function call." You'll receive one message per filtered GO with symbol, timeframe, direction, grade and score, confidence, entry, stop, and TP1/TP2/TP3. It fires once per bar close.
• Also available as separate conditions: GO LONG, GO SHORT, Trend Buy, Trend Sell, and optional CISD-formed alerts.
━━━━━━━━━━━━━━━━━━━━━━━━━━━━━━━━━━━━━━━
NOTES & LIMITATIONS
━━━━━━━━━━━━━━━━━━━━━━━━━━━━━━━━━━━━━━━
- The Entry/SL/TP lines and the dashboard levels follow the TREND position (from the last Buy/Sell flip). The Outcome Log and the GO alert use the GO bar's close as entry. These can differ, so use the alert or GO levels when trading GO signals.
- The outcome log is a forward simulation, not a broker-grade backtest. It includes no slippage, commissions, or partial fills. When the stop and a target are both touched on the same bar, it counts as a stop. Open trades are not counted. Results depend on how much history is loaded.
- CISD level lines extend and update live because structure is computed intrabar. The signal markers do not repaint while "confirm on close" is enabled.
- Scores are heuristics meant to rank setups, not probabilities.
For educational purposes only. Not financial advice.
A confluence indicator that combines an ATR-based trend engine with Change in State of Delivery (CISD) detection. A trade signal ("GO") prints only when both agree. Each signal is then graded for setup quality and trustworthiness, and an outcome log tests those signals forward on your chart's history so you can see which grades and exit styles actually performed.
The idea is simple: the trend flip is the TRIGGER, the CISD is the CONFIRMATION, and the verdict is the CONFLUENCE.
━━━━━━━━━━━━━━━━━━━━━━━━━━━━━━━━━━━━━━━
CREDITS
━━━━━━━━━━━━━━━━━━━━━━━━━━━━━━━━━━━━━━━
This indicator is built on two open-source scripts. Full credit to their authors:
- "Trend Signals with TP & SL" by UAlgo
Supplies the ATR trend engine, Buy/Sell signals, cloud, and the Entry/SL/TP framework. Originally Pine v5; migrated to v6 here.
- "CISD with Alerts" by neo|
Supplies the CISD structure-tracking engine and level drawing.
Thank you to both authors for sharing their work with the community. Everything beyond those two cores was added in this script: the confirmation gate, confluence logic, Strength and Confidence scoring, signal filter, outcome log, model-compare table, repaint controls, consolidated alert, and dashboard themes.
━━━━━━━━━━━━━━━━━━━━━━━━━━━━━━━━━━━━━━━
HOW IT WORKS
━━━━━━━━━━━━━━━━━━━━━━━━━━━━━━━━━━━━━━━
1) TREND ENGINE (from UAlgo)
An ATR band (source hl2, Sensitivity x ATR) trails price. When the close crosses the opposite band, the trend flips and a Buy or Sell label prints. A cloud built from the EMA of highs and the EMA of lows sits behind price. The cloud is tinted aqua when the MACD line is above zero and red when it is below.
On a trend flip, the script projects an Entry, Stop, and TP1/TP2/TP3. You can choose between two modes:
- Percent: the stop sits at Stop Loss % from entry, and the TPs sit at 1R, 2R, and 3R. Setting the percent to 0 turns levels off.
- ATR: the stop and the TPs are fixed ATR multiples, captured at the entry bar.
The trend position closes when the stop or TP3 is hit. Levels are drawn from the last trend-flip entry.
2) CISD ENGINE (from neo|)
The script tracks the opening price of pullback candle sequences. When market structure breaks, it draws a CISD level at the origin of the move that caused the break. A CISD becomes CONFIRMED when price closes through that level in one of two ways:
- Strong close: a single candle closes beyond the level, in the strong part of its own range (default: the top or bottom 50%), or
- 2-bar: two consecutive closes beyond the level (optional).
The confirmation candle is labeled "50% close" or "2-bar" and its background is highlighted. CISD state is tri-state: Bullish, Bearish, or None.
3) CONFLUENCE / GO SIGNALS
- GO LONG prints when the trend is bullish AND the CISD is bullish.
- GO SHORT prints when the trend is bearish AND the CISD is bearish.
- Only the first bar of a new alignment prints a marker.
- If the two disagree, the dashboard verdict reads CONFLICT.
4) STRENGTH SCORE (0-100, graded A+ to F)
This measures setup quality on the chart timeframe. Points come from:
- Alignment: 40 points (12 if there is no CISD yet)
- CISD confirmation quality: 20 for a strong close, 12 for 2-bar
- MACD momentum direction and slope: 15
- Close position versus the cloud: 10
- R:R to TP1: 10
- Freshness of the CISD (bars since it formed): 5
Grades: A+ is 90 or more, A is 80+, B is 70+, C is 60+, D is 50+, and anything lower is F.
5) CONFIDENCE SCORE (0-100: High, Med, or Low)
This measures how much to trust the read. Points come from:
- Higher-timeframe trend agreement: 40 (the default HTF is 60m)
- Trend persistence (bars since the last flip, and number of flips in the last 20 bars): 25
- Volatility regime (ATR14 versus its 50-bar average; calm conditions score higher): 20
- Extension from the cloud midpoint, measured in ATR (stretched price scores lower): 15
Tiers: High is 75 or more, Med is 50+, and anything lower is Low.
6) SIGNAL FILTER
Filter modes: Off, Strength only, Confidence only, Both required, or Either. You set a minimum grade and a minimum confidence %. GO signals that fail the filter print a small gray "×" so you can still see what was blocked.
7) OUTCOME LOG (expectancy table)
Every raw GO signal is logged before the filter is applied. Each one is entered at the GO bar's close and simulated forward on confirmed bars only. You choose one of three exit models:
- Scale thirds: take 1/3 at TP1 and move the stop to breakeven, take 1/3 at TP2 and move the stop to TP1, take the final 1/3 at TP3.
- All out at TP1: a single 1R target.
- Runner to TP3: full size held to TP3 or the stop, with a fixed stop.
The table reports N, Expectancy (average R per trade), and Win%. Results are shown overall, by Strength grade, and by Confidence tier. This is how you find out whether A grades actually outperform C grades on your instrument.
8) MODEL-COMPARE TABLE
All three exit models are run in parallel on the same signals. For each model the table shows N, Expectancy, Net R, Max Drawdown (in R), and Profit Factor. The row for your currently selected model is marked.
9) REPAINT CONTROL
- "Confirm signals on bar close" (on by default): Buy/Sell, GO, blocked markers, and CISD confirmation marks only appear after the bar closes.
- "HTF confidence: use last closed HTF bar" (on by default): the HTF component won't wiggle intrabar, at the cost of up to one HTF bar of lag.
The outcome log and the compare table always use confirmed bars only.
10) DASHBOARD
The dashboard shows Trend, CISD, Confirm method, Verdict, Strength, Confidence, Filter status, Position, Entry, Stop, TPs, R:R, and % from entry. There are two themes: Classic, and Futuristic (HUD), which uses a monospace font, a neon palette, and segmented meters.
━━━━━━━━━━━━━━━━━━━━━━━━━━━━━━━━━━━━━━━
HOW TO USE IT
━━━━━━━━━━━━━━━━━━━━━━━━━━━━━━━━━━━━━━━
1. Set the HTF. Under Confidence, set the higher timeframe above your execution chart (for example, 60 on a 5m chart, or 240 on a 15m or 1H chart).
2. Choose your risk model. Use Percent for clean R-multiples. Use ATR if you want stops that adapt to volatility.
3. Read the log before filtering. With the filter Off, scroll through plenty of history and study the Outcome Log and the Compare table. Look for which grades and confidence tiers show positive expectancy, and which exit model gives the best balance of Net R and Max Drawdown.
4. Set the filter to match the data. For example, if C-grade signals are negative but B and above are positive, set the Min grade to B. Choose the exit model that fits both the numbers and how you actually manage trades.
5. Trade the GO, not just the flip.
• Buy/Sell labels mean only that the trend has flipped.
• GO means the trend and the CISD agree.
• Prioritize GO signals that pass the filter and carry a High Confidence rating.
6. Set up alerts.
• Recommended: create an alert on this indicator with the condition "Any alert() function call." You'll receive one message per filtered GO with symbol, timeframe, direction, grade and score, confidence, entry, stop, and TP1/TP2/TP3. It fires once per bar close.
• Also available as separate conditions: GO LONG, GO SHORT, Trend Buy, Trend Sell, and optional CISD-formed alerts.
━━━━━━━━━━━━━━━━━━━━━━━━━━━━━━━━━━━━━━━
NOTES & LIMITATIONS
━━━━━━━━━━━━━━━━━━━━━━━━━━━━━━━━━━━━━━━
- The Entry/SL/TP lines and the dashboard levels follow the TREND position (from the last Buy/Sell flip). The Outcome Log and the GO alert use the GO bar's close as entry. These can differ, so use the alert or GO levels when trading GO signals.
- The outcome log is a forward simulation, not a broker-grade backtest. It includes no slippage, commissions, or partial fills. When the stop and a target are both touched on the same bar, it counts as a stop. Open trades are not counted. Results depend on how much history is loaded.
- CISD level lines extend and update live because structure is computed intrabar. The signal markers do not repaint while "confirm on close" is enabled.
- Scores are heuristics meant to rank setups, not probabilities.
For educational purposes only. Not financial advice.

Declinazione di responsabilità
Le informazioni e le pubblicazioni non sono intese come, e non costituiscono, consulenza o raccomandazioni finanziarie, di investimento, di trading o di altro tipo fornite o approvate da TradingView. Per ulteriori informazioni, consultare i Termini di utilizzo.
Declinazione di responsabilità
Le informazioni e le pubblicazioni non sono intese come, e non costituiscono, consulenza o raccomandazioni finanziarie, di investimento, di trading o di altro tipo fornite o approvate da TradingView. Per ulteriori informazioni, consultare i Termini di utilizzo.