OPEN-SOURCE SCRIPT
EDGE2.3 RSI DIV PRE-DIV MATRIX
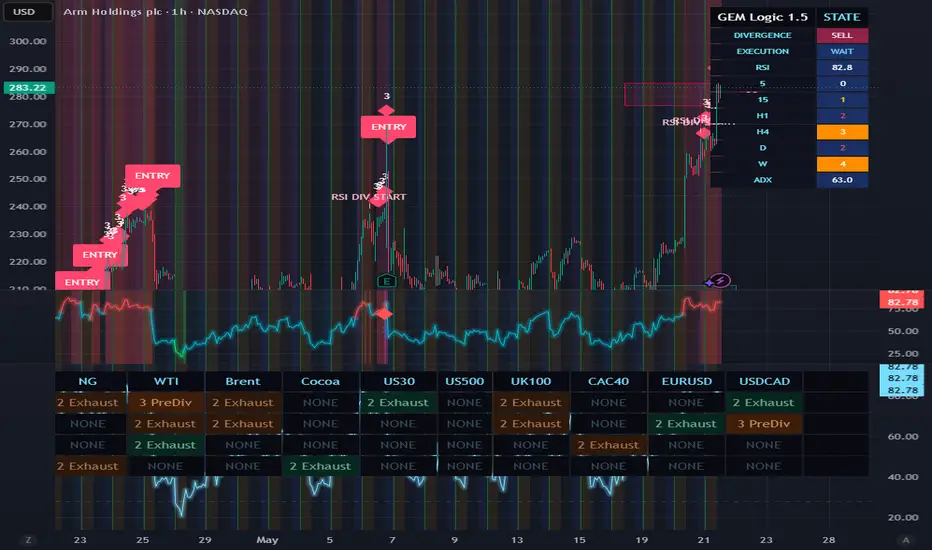
EDGE 2.3 RSI DIV PRE-DIV MATRIX
EDGE 2.3 RSI DIV PRE-DIV MATRIX is a multi-asset, multi-timeframe scanner built around RSI exhaustion, divergence detection, and pre-divergence pressure analysis.
This script is designed to help traders spot instruments that are not only already diverging, but also those that may be approaching divergence conditions before a full signal appears.
Instead of analyzing only one chart, the script scans a group of markets and shows their current state in a matrix table, making it easier to compare relative strength and weakness across assets and timeframes.
Core idea
Most indicators only react after a signal is already obvious.
This script tries to go one step earlier.
It combines three layers:
RSI extreme location
confirmed RSI divergence
pre-divergence exhaustion score
That means it can classify an instrument not only as “already diverging,” but also as:
merely stretched,
starting to weaken,
entering pre-divergence conditions,
or already producing a stronger divergence-based reversal setup.
What the script scans
The script monitors multiple instruments at once, including:
Natural Gas
WTI
Brent
Cocoa
US30
US500
UK100
CAC40
EURUSD
USDCAD
For each one, it checks four timeframes:
15m
H1
H4
D
All results are displayed in a matrix table in the top-right corner.
Main building blocks
1. RSI engine
The script starts with RSI as the base momentum tool.
It defines two key RSI zones:
Overbought
Oversold
These zones are used as the first filter for potential reversal pressure.
If RSI is high enough, the script starts looking for bearish conditions.
If RSI is low enough, it starts looking for bullish conditions.
2. Divergence engine
The divergence engine tracks whether price is making a new extreme while RSI is failing to confirm it.
Bearish divergence logic
A bearish raw divergence appears when:
RSI is in overbought territory,
price makes a higher high,
but RSI does not make a higher high.
Bullish divergence logic
A bullish raw divergence appears when:
RSI is in oversold territory,
price makes a lower low,
but RSI does not make a lower low.
The script does not stop at one raw divergence.
It counts how many such events occurred within the lookback window.
Only after at least 3 divergence events does it classify the condition as a stronger confirmed divergence state.
This is important because it reduces noise and avoids treating every single mismatch between price and RSI as equally meaningful.
3. Pre-divergence score engine
This is one of the most distinctive parts of the script.
The script tries to measure whether a market is losing force before divergence fully appears.
It does this by combining several exhaustion-style clues into a score.
Inputs used in the pre-divergence score
The score considers:
Body compression
Recent candle bodies are compared against older bodies to see whether momentum is shrinking.
Price continuation with weaker internals
Price may still be pushing higher or lower, but the internals start weakening.
Volume divergence
Price continues moving, but volume is weaker than before.
RSI weakening
RSI is still elevated or depressed, but its rate of change is weakening.
MACD histogram weakening
Momentum may still exist, but the histogram begins fading.
ATR flattening
Volatility expansion starts slowing down.
Distance from EMA
Price becomes stretched away from the 50 EMA, which can suggest reduced sustainability.
Weak follow-through after impulse
Price had a prior impulsive move, but current progress is weak.
Relative volume fade after a spike
Participation cools off after a stronger earlier push.
Each of these pieces contributes points to either a bearish pre-divergence score or a bullish pre-divergence score.
Why this matters
A regular divergence indicator usually tells you:
“Divergence is here.”
This script also tries to tell you:
“The market is starting to behave like divergence may be coming soon.”
That makes the script useful not only for confirmation, but also for watchlist preparation and early market screening.
Signal hierarchy
The script converts all this logic into a ranked signal system.
Each instrument/timeframe gets one signal state:
Signal levels
5 Strong
strongest bullish or bearish condition
RSI extreme plus confirmed divergence
4 Diverg
confirmed divergence is present
3 PreDiv
strong pre-divergence score is active
2 Exhaust
watch-level exhaustion / weakening is active
1 RSI
only RSI extreme is present
NONE
no relevant condition at the moment
These states are directional:
bullish states are shown in green-style colors
bearish states are shown in red/orange-style colors
So the table gives both:
strength
direction
Visual design of the matrix
The matrix is intentionally compact and color-coded.
Header row
The top row shows the names of all scanned instruments.
Left column
The first column shows the timeframe:
15
H1
H4
D
Inner cells
Each cell displays the current state text, such as:
5 Strong
4 Diverg
3 PreDiv
2 Exhaust
1 RSI
NONE
Each cell also has a matching background and text color based on the signal type.
This makes the scanner readable at a glance:
strong bullish conditions stand out in brighter green tones
strong bearish conditions stand out in brighter red/orange tones
weaker or neutral states fade into darker tones
Current chart RSI panel
Besides the matrix scanner, the script also plots RSI for the current chart.
It adds:
layered RSI plotting for a neon-style appearance,
overbought line,
oversold line,
middle line at 50.
So even though the main strength of the script is the scanner table, the current chart still keeps a live RSI reference.
How to interpret the matrix
A simple reading model:
1. RSI only
If a cell says 1 RSI, the market is stretched, but there is no deeper confirmation yet.
This is only an alert to pay attention.
2. Exhaust
If a cell says 2 Exhaust, the market is beginning to lose efficiency internally.
This means the move may be weakening, but divergence is not fully formed yet.
3. PreDiv
If a cell says 3 PreDiv, the script sees stronger internal evidence that a divergence-style condition may be developing.
This is often a more interesting watchlist stage.
4. Diverg
If a cell says 4 Diverg, confirmed divergence logic has already been reached.
This means the mismatch between price and momentum is no longer just a suspicion.
5. Strong
If a cell says 5 Strong, the script sees the strongest alignment:
RSI extreme plus confirmed divergence.
This is the most advanced state in the hierarchy.
Practical use cases
This script can be used in several ways.
Market scanner
You can use it as a dashboard to find which instruments are becoming technically interesting right now.
Cross-market comparison
Because it scans multiple asset classes, it helps compare:
energy
commodities
indices
FX
Reversal preparation
The pre-divergence score is useful for spotting markets that are not yet reversing, but are beginning to show internal weakness.
Timeframe stacking
When the same instrument starts showing stronger states on multiple timeframes, it may deserve closer attention.
For example:
15m = Exhaust
H1 = PreDiv
H4 = Diverg
That kind of progression can be much more useful than looking at one timeframe in isolation.
Strengths of this script
1. It is not limited to plain RSI extremes
A lot of scripts stop at overbought/oversold.
This one goes deeper.
2. It distinguishes early weakness from confirmed divergence
That gives a more nuanced market read.
3. It is multi-asset and multi-timeframe
This makes it practical as a scanner, not just a single-chart tool.
4. It blends momentum, volatility, structure, and participation clues
The pre-divergence engine uses more than one idea, which helps reduce simplistic interpretation.
5. It is visually fast to read
The matrix format is efficient for broad market review.
Things to keep in mind
This script is still a context tool, not a guarantee engine.
It does not promise reversals.
It does not replace execution rules.
It does not replace risk management.
A strong state in the matrix means:
the market is technically interesting,
pressure may be building,
and more detailed chart review may be justified.
But it should still be combined with:
price structure,
risk planning,
trade management,
and broader market context.
In plain English
If explained very simply:
This script asks:
“Is this market only stretched, or is it actually starting to weaken under the surface?”
And then it ranks that answer from:
mild RSI pressure,
to early exhaustion,
to pre-divergence,
to confirmed divergence,
to strongest divergence condition.
It does this across several instruments and several timeframes at once.
Short summary
EDGE2.3 RSI DIV PRE-DIV MATRIX is a market scanner that combines:
RSI extremes
divergence logic
pre-divergence scoring
multi-asset scanning
multi-timeframe matrix visualization
EDGE 2.3 RSI DIV PRE-DIV MATRIX is a multi-asset, multi-timeframe scanner built around RSI exhaustion, divergence detection, and pre-divergence pressure analysis.
This script is designed to help traders spot instruments that are not only already diverging, but also those that may be approaching divergence conditions before a full signal appears.
Instead of analyzing only one chart, the script scans a group of markets and shows their current state in a matrix table, making it easier to compare relative strength and weakness across assets and timeframes.
Core idea
Most indicators only react after a signal is already obvious.
This script tries to go one step earlier.
It combines three layers:
RSI extreme location
confirmed RSI divergence
pre-divergence exhaustion score
That means it can classify an instrument not only as “already diverging,” but also as:
merely stretched,
starting to weaken,
entering pre-divergence conditions,
or already producing a stronger divergence-based reversal setup.
What the script scans
The script monitors multiple instruments at once, including:
Natural Gas
WTI
Brent
Cocoa
US30
US500
UK100
CAC40
EURUSD
USDCAD
For each one, it checks four timeframes:
15m
H1
H4
D
All results are displayed in a matrix table in the top-right corner.
Main building blocks
1. RSI engine
The script starts with RSI as the base momentum tool.
It defines two key RSI zones:
Overbought
Oversold
These zones are used as the first filter for potential reversal pressure.
If RSI is high enough, the script starts looking for bearish conditions.
If RSI is low enough, it starts looking for bullish conditions.
2. Divergence engine
The divergence engine tracks whether price is making a new extreme while RSI is failing to confirm it.
Bearish divergence logic
A bearish raw divergence appears when:
RSI is in overbought territory,
price makes a higher high,
but RSI does not make a higher high.
Bullish divergence logic
A bullish raw divergence appears when:
RSI is in oversold territory,
price makes a lower low,
but RSI does not make a lower low.
The script does not stop at one raw divergence.
It counts how many such events occurred within the lookback window.
Only after at least 3 divergence events does it classify the condition as a stronger confirmed divergence state.
This is important because it reduces noise and avoids treating every single mismatch between price and RSI as equally meaningful.
3. Pre-divergence score engine
This is one of the most distinctive parts of the script.
The script tries to measure whether a market is losing force before divergence fully appears.
It does this by combining several exhaustion-style clues into a score.
Inputs used in the pre-divergence score
The score considers:
Body compression
Recent candle bodies are compared against older bodies to see whether momentum is shrinking.
Price continuation with weaker internals
Price may still be pushing higher or lower, but the internals start weakening.
Volume divergence
Price continues moving, but volume is weaker than before.
RSI weakening
RSI is still elevated or depressed, but its rate of change is weakening.
MACD histogram weakening
Momentum may still exist, but the histogram begins fading.
ATR flattening
Volatility expansion starts slowing down.
Distance from EMA
Price becomes stretched away from the 50 EMA, which can suggest reduced sustainability.
Weak follow-through after impulse
Price had a prior impulsive move, but current progress is weak.
Relative volume fade after a spike
Participation cools off after a stronger earlier push.
Each of these pieces contributes points to either a bearish pre-divergence score or a bullish pre-divergence score.
Why this matters
A regular divergence indicator usually tells you:
“Divergence is here.”
This script also tries to tell you:
“The market is starting to behave like divergence may be coming soon.”
That makes the script useful not only for confirmation, but also for watchlist preparation and early market screening.
Signal hierarchy
The script converts all this logic into a ranked signal system.
Each instrument/timeframe gets one signal state:
Signal levels
5 Strong
strongest bullish or bearish condition
RSI extreme plus confirmed divergence
4 Diverg
confirmed divergence is present
3 PreDiv
strong pre-divergence score is active
2 Exhaust
watch-level exhaustion / weakening is active
1 RSI
only RSI extreme is present
NONE
no relevant condition at the moment
These states are directional:
bullish states are shown in green-style colors
bearish states are shown in red/orange-style colors
So the table gives both:
strength
direction
Visual design of the matrix
The matrix is intentionally compact and color-coded.
Header row
The top row shows the names of all scanned instruments.
Left column
The first column shows the timeframe:
15
H1
H4
D
Inner cells
Each cell displays the current state text, such as:
5 Strong
4 Diverg
3 PreDiv
2 Exhaust
1 RSI
NONE
Each cell also has a matching background and text color based on the signal type.
This makes the scanner readable at a glance:
strong bullish conditions stand out in brighter green tones
strong bearish conditions stand out in brighter red/orange tones
weaker or neutral states fade into darker tones
Current chart RSI panel
Besides the matrix scanner, the script also plots RSI for the current chart.
It adds:
layered RSI plotting for a neon-style appearance,
overbought line,
oversold line,
middle line at 50.
So even though the main strength of the script is the scanner table, the current chart still keeps a live RSI reference.
How to interpret the matrix
A simple reading model:
1. RSI only
If a cell says 1 RSI, the market is stretched, but there is no deeper confirmation yet.
This is only an alert to pay attention.
2. Exhaust
If a cell says 2 Exhaust, the market is beginning to lose efficiency internally.
This means the move may be weakening, but divergence is not fully formed yet.
3. PreDiv
If a cell says 3 PreDiv, the script sees stronger internal evidence that a divergence-style condition may be developing.
This is often a more interesting watchlist stage.
4. Diverg
If a cell says 4 Diverg, confirmed divergence logic has already been reached.
This means the mismatch between price and momentum is no longer just a suspicion.
5. Strong
If a cell says 5 Strong, the script sees the strongest alignment:
RSI extreme plus confirmed divergence.
This is the most advanced state in the hierarchy.
Practical use cases
This script can be used in several ways.
Market scanner
You can use it as a dashboard to find which instruments are becoming technically interesting right now.
Cross-market comparison
Because it scans multiple asset classes, it helps compare:
energy
commodities
indices
FX
Reversal preparation
The pre-divergence score is useful for spotting markets that are not yet reversing, but are beginning to show internal weakness.
Timeframe stacking
When the same instrument starts showing stronger states on multiple timeframes, it may deserve closer attention.
For example:
15m = Exhaust
H1 = PreDiv
H4 = Diverg
That kind of progression can be much more useful than looking at one timeframe in isolation.
Strengths of this script
1. It is not limited to plain RSI extremes
A lot of scripts stop at overbought/oversold.
This one goes deeper.
2. It distinguishes early weakness from confirmed divergence
That gives a more nuanced market read.
3. It is multi-asset and multi-timeframe
This makes it practical as a scanner, not just a single-chart tool.
4. It blends momentum, volatility, structure, and participation clues
The pre-divergence engine uses more than one idea, which helps reduce simplistic interpretation.
5. It is visually fast to read
The matrix format is efficient for broad market review.
Things to keep in mind
This script is still a context tool, not a guarantee engine.
It does not promise reversals.
It does not replace execution rules.
It does not replace risk management.
A strong state in the matrix means:
the market is technically interesting,
pressure may be building,
and more detailed chart review may be justified.
But it should still be combined with:
price structure,
risk planning,
trade management,
and broader market context.
In plain English
If explained very simply:
This script asks:
“Is this market only stretched, or is it actually starting to weaken under the surface?”
And then it ranks that answer from:
mild RSI pressure,
to early exhaustion,
to pre-divergence,
to confirmed divergence,
to strongest divergence condition.
It does this across several instruments and several timeframes at once.
Short summary
EDGE2.3 RSI DIV PRE-DIV MATRIX is a market scanner that combines:
RSI extremes
divergence logic
pre-divergence scoring
multi-asset scanning
multi-timeframe matrix visualization
Script open-source
Nello spirito di TradingView, l'autore di questo script lo ha reso open source, in modo che i trader possano esaminarne e verificarne la funzionalità. Complimenti all'autore! Sebbene sia possibile utilizzarlo gratuitamente, ricordiamo che la ripubblicazione del codice è soggetta al nostro Regolamento.

Declinazione di responsabilità
Le informazioni e le pubblicazioni non sono intese come, e non costituiscono, consulenza o raccomandazioni finanziarie, di investimento, di trading o di altro tipo fornite o approvate da TradingView. Per ulteriori informazioni, consultare i Termini di utilizzo.
Script open-source
Nello spirito di TradingView, l'autore di questo script lo ha reso open source, in modo che i trader possano esaminarne e verificarne la funzionalità. Complimenti all'autore! Sebbene sia possibile utilizzarlo gratuitamente, ricordiamo che la ripubblicazione del codice è soggetta al nostro Regolamento.
Declinazione di responsabilità
Le informazioni e le pubblicazioni non sono intese come, e non costituiscono, consulenza o raccomandazioni finanziarie, di investimento, di trading o di altro tipo fornite o approvate da TradingView. Per ulteriori informazioni, consultare i Termini di utilizzo.