OPEN-SOURCE SCRIPT
Price-Point Volume Oscillator [LuxAlgo]
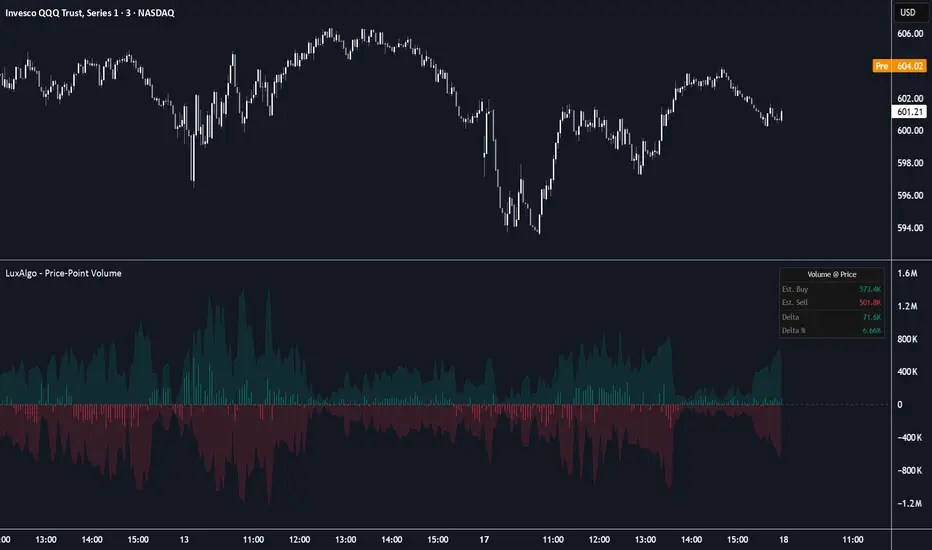
The Price-Point Volume Oscillator indicator estimates the volume distribution at the current price level by analyzing historical bars that intersect with the current market price.
🔶 USAGE
This tool provides a unique perspective on volume by filtering historical price action to show only the volume that occurred when the price was at its current level. This helps traders identify whether the current price point has historically been a zone of high buying pressure, heavy selling, or balanced distribution.
The indicator consists of several visual components:
Traders can use this oscillator to confirm support or resistance levels. For example, if the price approaches a previous level and the Delta Histogram shows significant buying volume at that specific price point, it may suggest strong historical demand.
🔶 DETAILS
The script operates by looping through a user-defined lookback window. For every historical bar, it checks if the current close price falls within that bar's High-Low range. If it does, the volume from that historical bar is "allocated" to the current price level.
To differentiate between buying and selling volume, the script uses a ratio based on where the historical bar closed relative to its range. If a historical bar closed near its high, a larger portion of its volume is attributed to "Buy Volume" at the current price.
🔶 SETTINGS
🔹 Settings
🔹 Visuals
🔶 USAGE
This tool provides a unique perspective on volume by filtering historical price action to show only the volume that occurred when the price was at its current level. This helps traders identify whether the current price point has historically been a zone of high buying pressure, heavy selling, or balanced distribution.
The indicator consists of several visual components:
- Buy/Sell Volume Areas: The background shows the estimated buying volume (green area) and selling volume (red area) accumulated at the current price over the lookback period.
- Volume Delta Histogram: The central histogram represents the net difference (Delta) between buy and sell volume. A green histogram indicates a net positive buying bias at the current price, while a red histogram indicates a net negative selling bias.
- Dashboard: A real-time table providing specific metrics, including estimated Buy/Sell totals, the net Delta, and the Delta Percentage.
Traders can use this oscillator to confirm support or resistance levels. For example, if the price approaches a previous level and the Delta Histogram shows significant buying volume at that specific price point, it may suggest strong historical demand.
🔶 DETAILS
The script operates by looping through a user-defined lookback window. For every historical bar, it checks if the current close price falls within that bar's High-Low range. If it does, the volume from that historical bar is "allocated" to the current price level.
To differentiate between buying and selling volume, the script uses a ratio based on where the historical bar closed relative to its range. If a historical bar closed near its high, a larger portion of its volume is attributed to "Buy Volume" at the current price.
🔶 SETTINGS
🔹 Settings
- Lookback Window: Determines the number of historical bars the indicator analyzes to find price intersections. A larger window provides a more comprehensive historical view but requires more calculations.
🔹 Visuals
- Show Dashboard: Toggles the visibility of the real-time statistics table.
- Position: Controls where the dashboard is anchored on the chart (Top Right, Bottom Right, or Bottom Left).
- Size: Adjusts the text and table size of the dashboard to fit different screen resolutions.
Script open-source
Nello spirito di TradingView, l'autore di questo script lo ha reso open source, in modo che i trader possano esaminarne e verificarne la funzionalità. Complimenti all'autore! Sebbene sia possibile utilizzarlo gratuitamente, ricordiamo che la ripubblicazione del codice è soggetta al nostro Regolamento.

All content & scripts provided by LuxAlgo are for educational purposes only and are not financial advice.
Declinazione di responsabilità
Le informazioni e le pubblicazioni non sono intese come, e non costituiscono, consulenza o raccomandazioni finanziarie, di investimento, di trading o di altro tipo fornite o approvate da TradingView. Per ulteriori informazioni, consultare i Termini di utilizzo.
Script open-source
Nello spirito di TradingView, l'autore di questo script lo ha reso open source, in modo che i trader possano esaminarne e verificarne la funzionalità. Complimenti all'autore! Sebbene sia possibile utilizzarlo gratuitamente, ricordiamo che la ripubblicazione del codice è soggetta al nostro Regolamento.
Declinazione di responsabilità
Le informazioni e le pubblicazioni non sono intese come, e non costituiscono, consulenza o raccomandazioni finanziarie, di investimento, di trading o di altro tipo fornite o approvate da TradingView. Per ulteriori informazioni, consultare i Termini di utilizzo.