Exponential Regression Channel
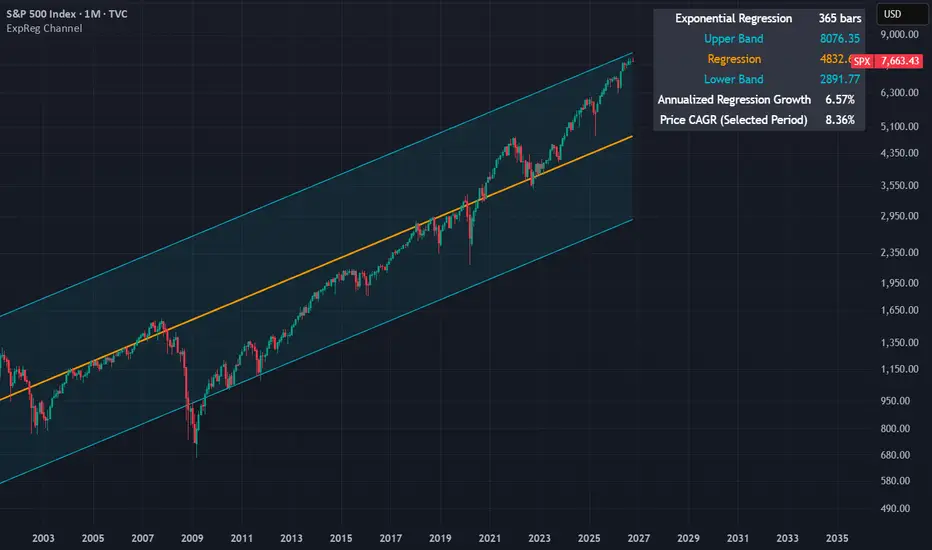
Exponential Regression Channel
This indicator fits an exponential trend to price and draws a channel based on the standard deviation of log-price residuals. It is designed for analyzing proportional price growth and deviations from that trend. IT WORKS BEST ON LOGARITHMIC CHARTS.
HOW IT WORKS
The script applies least-squares linear regression to the natural logarithm of the selected price source:
ln(Price) = a + b × x
The fitted values are then converted back into price:
Regression = exp(a + b × x)
This produces a trend with a constant compounded growth rate within the selected window. On a logarithmic chart, the regression and its channel boundaries appear as straight, parallel lines.
CHANNEL CALCULATION
Channel width is calculated from deviations between log prices and their fitted regression values:
σ = sqrt(sum of squared log-price residuals / N)
Upper Band = exp(a + b × x + Multiplier × σ)
Lower Band = exp(a + b × x − Multiplier × σ)
The default multiplier is 2.0. Because the calculation takes place in log space, the bands represent multiplicative deviations rather than fixed price distances.
FEATURES
• Adjustable regression length from 3 to 2,000 bars.
• Selectable price source.
• Adjustable standard deviation multiplier.
• Customizable line colors and optional channel shading.
• Information table showing the latest regression value, upper and lower bands.
HOW TO USE
Enable the chart’s logarithmic price scale and choose a regression length appropriate to your analysis. For example, 120 bars on a monthly chart covers 10 years of monthly observations.
Use the center line to assess the prevailing growth trend and the bands to evaluate how far the price has moved above or below that trend.
INTERPRETATION AND LIMITATIONS
The channel is recalculated over the latest N bars. Its historical position changes as the window advances, and values can update while the current bar is open.
Standard deviation bands do not require normally distributed residuals. However, a ±2σ channel does not guarantee 95% historical coverage or a 95% probability of containing future prices.
A band touch or breakout is not, by itself, a buy or sell signal. Persistent trends and changing market conditions can keep price outside the channel.
The selected price source must contain positive, non-missing values. Results depend on the symbol, timeframe, source, and regression length.
For analytical and educational use.
This indicator fits an exponential trend to price and draws a channel based on the standard deviation of log-price residuals. It is designed for analyzing proportional price growth and deviations from that trend. IT WORKS BEST ON LOGARITHMIC CHARTS.
HOW IT WORKS
The script applies least-squares linear regression to the natural logarithm of the selected price source:
ln(Price) = a + b × x
The fitted values are then converted back into price:
Regression = exp(a + b × x)
This produces a trend with a constant compounded growth rate within the selected window. On a logarithmic chart, the regression and its channel boundaries appear as straight, parallel lines.
CHANNEL CALCULATION
Channel width is calculated from deviations between log prices and their fitted regression values:
σ = sqrt(sum of squared log-price residuals / N)
Upper Band = exp(a + b × x + Multiplier × σ)
Lower Band = exp(a + b × x − Multiplier × σ)
The default multiplier is 2.0. Because the calculation takes place in log space, the bands represent multiplicative deviations rather than fixed price distances.
FEATURES
• Adjustable regression length from 3 to 2,000 bars.
• Selectable price source.
• Adjustable standard deviation multiplier.
• Customizable line colors and optional channel shading.
• Information table showing the latest regression value, upper and lower bands.
HOW TO USE
Enable the chart’s logarithmic price scale and choose a regression length appropriate to your analysis. For example, 120 bars on a monthly chart covers 10 years of monthly observations.
Use the center line to assess the prevailing growth trend and the bands to evaluate how far the price has moved above or below that trend.
INTERPRETATION AND LIMITATIONS
The channel is recalculated over the latest N bars. Its historical position changes as the window advances, and values can update while the current bar is open.
Standard deviation bands do not require normally distributed residuals. However, a ±2σ channel does not guarantee 95% historical coverage or a 95% probability of containing future prices.
A band touch or breakout is not, by itself, a buy or sell signal. Persistent trends and changing market conditions can keep price outside the channel.
The selected price source must contain positive, non-missing values. Results depend on the symbol, timeframe, source, and regression length.
For analytical and educational use.

Declinazione di responsabilità
Le informazioni e le pubblicazioni non sono intese come, e non costituiscono, consulenza o raccomandazioni finanziarie, di investimento, di trading o di altro tipo fornite o approvate da TradingView. Per ulteriori informazioni, consultare i Termini di utilizzo.
Declinazione di responsabilità
Le informazioni e le pubblicazioni non sono intese come, e non costituiscono, consulenza o raccomandazioni finanziarie, di investimento, di trading o di altro tipo fornite o approvate da TradingView. Per ulteriori informazioni, consultare i Termini di utilizzo.