OPEN-SOURCE SCRIPT
Global Liquidity Index (Z-Score)
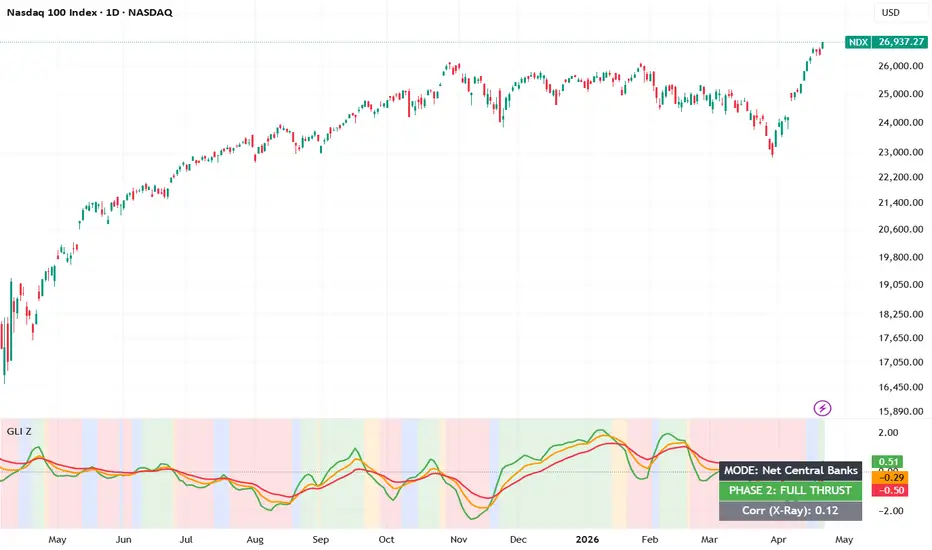
Global Liquidity Index (Quant Normalized Edition)
Overview
The Global Liquidity Index (Quant Normalized Edition) is a professional-grade macro indicator designed to track the "lifeblood" of financial markets: Fiat Liquidity. Unlike retail-focused momentum oscillators, this tool dives deep into the Market Plumbing of the world’s major central banks to provide a lead-lag perspective on asset prices.
The Core Logic
Liquidity is not a single number; it is a flow. This indicator aggregates data from the Federal Reserve (FED), ECB, PBoC, BoJ, BoE, and SNB.
It offers two distinct calculation modes:
-Net Central Banks: Focuses on the "true" spendable liquidity by calculating: (Balance Sheet - RRP - TGA) for the US, plus major global central bank assets.
-Global M2: Tracks the broad money supply growth across the world's largest economies.
Key Features
-Z-Score Normalization Layer: The breakthrough feature of this version. By applying a Z-score normalization to the liquidity Rate of Change (ROC), the script standardizes the different magnitudes of central bank balance sheets. This ensures that a massive move in the PBoC is weighted correctly against the FED, providing a balanced signal.
-4-Phase Liquidity Engine: The indicator categorizes the market regime into four distinct stages:
Phase 1: IGNITION (Blue) – Liquidity is beginning to accelerate, often preceding a major breakout.
Phase 2: FULL THRUST (Green) – Maximum liquidity momentum; the "Golden Window" for trend-following.
Phase 3: ROTATION (Orange) – Liquidity is decelerating. Momentum is fading, suggesting risk-off or distribution.
Phase 4: DROUGHT (Red) – Net liquidity is contracting.Historically associated with increased volatility and "rug pulls".
-X-Ray Projection (Offset): Includes a time-shifting engine that allows users to project the liquidity signal forward (or backward) to identify lead-lag correlations with price action.
-Dynamic Correlation: An integrated dashboard shows the real-time correlation between the liquidity flow and the current chart's price action.
How to Use
-Bullish Environments: Look for Phase 1 (Ignition) transitions into Phase 2 (Full Thrust).
-Risk Mitigation: Be cautious when the signal enters Phase 3 (Rotation), as this often marks the "topping out" of the liquidity cycle.
-Divergence: Watch for "Price vs. Liquidity" divergences, where price moves higher while liquidity (GLI) is making lower highs.
Credits & Disclaimer
Credits: The foundational macro-data fetching logic was inspired by the original work of QuantitativeAlpha. This version has been deeply modified and independently developed to include a proprietary Z-Score normalization layer, a time-shifting engine, and a 4-phase algorithmic regime filter.
Disclaimer: This indicator is for educational and informational purposes only. It does not constitute financial or investment advice.
Script open-source
Nello spirito di TradingView, l'autore di questo script lo ha reso open source, in modo che i trader possano esaminarne e verificarne la funzionalità. Complimenti all'autore! Sebbene sia possibile utilizzarlo gratuitamente, ricordiamo che la ripubblicazione del codice è soggetta al nostro Regolamento.

Declinazione di responsabilità
Le informazioni e le pubblicazioni non sono intese come, e non costituiscono, consulenza o raccomandazioni finanziarie, di investimento, di trading o di altro tipo fornite o approvate da TradingView. Per ulteriori informazioni, consultare i Termini di utilizzo.
Script open-source
Nello spirito di TradingView, l'autore di questo script lo ha reso open source, in modo che i trader possano esaminarne e verificarne la funzionalità. Complimenti all'autore! Sebbene sia possibile utilizzarlo gratuitamente, ricordiamo che la ripubblicazione del codice è soggetta al nostro Regolamento.
Declinazione di responsabilità
Le informazioni e le pubblicazioni non sono intese come, e non costituiscono, consulenza o raccomandazioni finanziarie, di investimento, di trading o di altro tipo fornite o approvate da TradingView. Per ulteriori informazioni, consultare i Termini di utilizzo.