Aggiornato
Auto Retracement Levels
Auto Retracement Levels
Overview
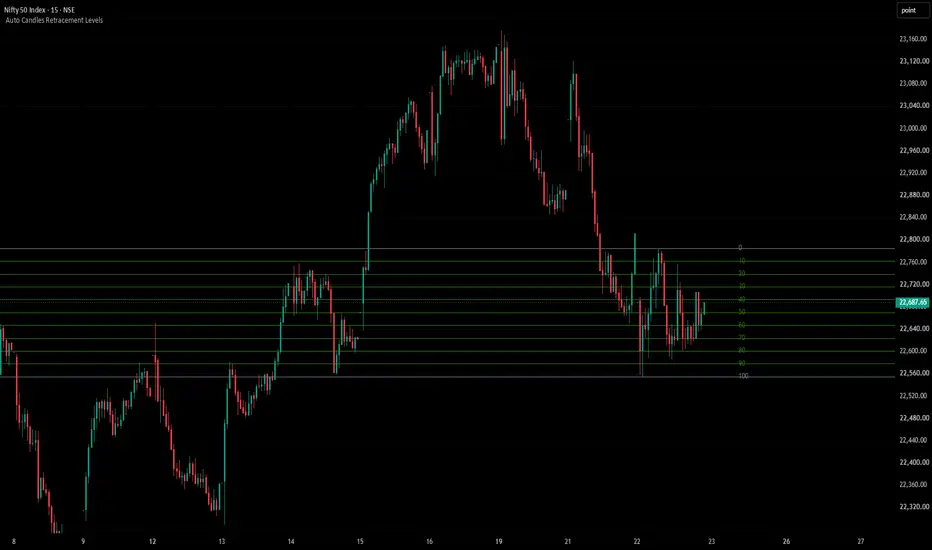
Auto Retracement Levels is a TradingView indicator designed to automatically identify the highest high and lowest low within a user-defined lookback period and plot 11 horizontal retracement levels across the chart.
The indicator helps traders visualize potential support and resistance areas, retracement zones, and important price levels without manually drawing Fibonacci-style lines. It is built using Pine Script® version 6 and is designed to work directly on the price chart.
Key Features
1. Automatic Retracement Levels
The indicator calculates the highest high and lowest low over the selected number of candles and automatically plots the following 11 levels:
0%
10%
20%
30%
40%
50%
60%
70%
80%
90%
100%
The levels update as the lookback range changes with incoming price data.
2. Customizable Candle Lookback
Adjust the number of candles used to calculate the high and low, from 1 to 5,000 candles.
A shorter lookback focuses on recent price action, while a longer lookback captures a broader price range.
3. Reverse Levels Option
Enable or disable the Reverse Levels setting to change the direction in which the intermediate retracement levels are calculated between the selected high and low.
This allows traders to view the levels in different orientations depending on their chart analysis preferences.
4. Customizable Line Appearance
Personalize the appearance of the indicator with the following settings:
Solid or dotted horizontal lines.
Adjustable line width from 1 to 3.
Individual color settings for all 11 levels.
Lines extended in both directions across the chart.
5. Adjustable Level Labels
Control the placement of level labels with two settings:
Horizontal Offset: moves labels to the right of the current bar.
Vertical Offset: adjusts the label position above each level.
These settings help organize the chart and improve readability.
6. Optional Candle Gap Filling
The indicator includes an optional candle gap filling feature.
When enabled, each candle's opening price is set to the previous candle's closing price. The displayed high and low are adjusted to include the previous close, while the current closing price remains unchanged.
This changes the visual representation of candles to reduce visible gaps between consecutive bars. The original market OHLC data is not modified.
7. Custom Candle Colors
The indicator displays custom-colored candles:
Teal for bullish candles.
Red for bearish candles.
When gap filling is enabled, candle colors are determined using the adjusted opening and closing values.
How to Use
Add the indicator to your TradingView chart.
Open the indicator's settings.
Set the desired number of candles in the lookback period.
Enable or disable Reverse Levels according to your preferred level orientation.
Customize the level colors, line style, and line width.
Adjust label offsets for better chart visibility.
Enable Candle Gap Filling if you prefer the adjusted candle display.
Potential Applications
Traders may use these levels as a visual reference when studying:
Potential support and resistance areas.
Price retracements within a selected range.
Pullbacks during trending markets.
Possible reaction zones.
Price structure across different timeframes.
The levels can be combined with other technical analysis tools, such as trendlines, moving averages, volume analysis, and price action.
Important Notes
The indicator uses the highest high and lowest low within the selected candle lookback period.
The plotted levels can change as new candles enter the calculation window.
The 10% increments are fixed in the script and cannot be changed through the settings.
These are Fibonacci-style percentage levels, not the conventional Fibonacci retracement sequence.
The indicator does not generate buy or sell signals and does not guarantee that price will react at any particular level.
The indicator is a charting and technical analysis tool, not financial advice.
Always use your own analysis and risk management when making trading decisions.
Overview
Auto Retracement Levels is a TradingView indicator designed to automatically identify the highest high and lowest low within a user-defined lookback period and plot 11 horizontal retracement levels across the chart.
The indicator helps traders visualize potential support and resistance areas, retracement zones, and important price levels without manually drawing Fibonacci-style lines. It is built using Pine Script® version 6 and is designed to work directly on the price chart.
Key Features
1. Automatic Retracement Levels
The indicator calculates the highest high and lowest low over the selected number of candles and automatically plots the following 11 levels:
0%
10%
20%
30%
40%
50%
60%
70%
80%
90%
100%
The levels update as the lookback range changes with incoming price data.
2. Customizable Candle Lookback
Adjust the number of candles used to calculate the high and low, from 1 to 5,000 candles.
A shorter lookback focuses on recent price action, while a longer lookback captures a broader price range.
3. Reverse Levels Option
Enable or disable the Reverse Levels setting to change the direction in which the intermediate retracement levels are calculated between the selected high and low.
This allows traders to view the levels in different orientations depending on their chart analysis preferences.
4. Customizable Line Appearance
Personalize the appearance of the indicator with the following settings:
Solid or dotted horizontal lines.
Adjustable line width from 1 to 3.
Individual color settings for all 11 levels.
Lines extended in both directions across the chart.
5. Adjustable Level Labels
Control the placement of level labels with two settings:
Horizontal Offset: moves labels to the right of the current bar.
Vertical Offset: adjusts the label position above each level.
These settings help organize the chart and improve readability.
6. Optional Candle Gap Filling
The indicator includes an optional candle gap filling feature.
When enabled, each candle's opening price is set to the previous candle's closing price. The displayed high and low are adjusted to include the previous close, while the current closing price remains unchanged.
This changes the visual representation of candles to reduce visible gaps between consecutive bars. The original market OHLC data is not modified.
7. Custom Candle Colors
The indicator displays custom-colored candles:
Teal for bullish candles.
Red for bearish candles.
When gap filling is enabled, candle colors are determined using the adjusted opening and closing values.
How to Use
Add the indicator to your TradingView chart.
Open the indicator's settings.
Set the desired number of candles in the lookback period.
Enable or disable Reverse Levels according to your preferred level orientation.
Customize the level colors, line style, and line width.
Adjust label offsets for better chart visibility.
Enable Candle Gap Filling if you prefer the adjusted candle display.
Potential Applications
Traders may use these levels as a visual reference when studying:
Potential support and resistance areas.
Price retracements within a selected range.
Pullbacks during trending markets.
Possible reaction zones.
Price structure across different timeframes.
The levels can be combined with other technical analysis tools, such as trendlines, moving averages, volume analysis, and price action.
Important Notes
The indicator uses the highest high and lowest low within the selected candle lookback period.
The plotted levels can change as new candles enter the calculation window.
The 10% increments are fixed in the script and cannot be changed through the settings.
These are Fibonacci-style percentage levels, not the conventional Fibonacci retracement sequence.
The indicator does not generate buy or sell signals and does not guarantee that price will react at any particular level.
The indicator is a charting and technical analysis tool, not financial advice.
Always use your own analysis and risk management when making trading decisions.
Note di rilascio
Only name changed 
Declinazione di responsabilità
Le informazioni e le pubblicazioni non sono intese come, e non costituiscono, consulenza o raccomandazioni finanziarie, di investimento, di trading o di altro tipo fornite o approvate da TradingView. Per ulteriori informazioni, consultare i Termini di utilizzo.
Declinazione di responsabilità
Le informazioni e le pubblicazioni non sono intese come, e non costituiscono, consulenza o raccomandazioni finanziarie, di investimento, di trading o di altro tipo fornite o approvate da TradingView. Per ulteriori informazioni, consultare i Termini di utilizzo.