OPEN-SOURCE SCRIPT
GME Quarterly OPEX Analysis
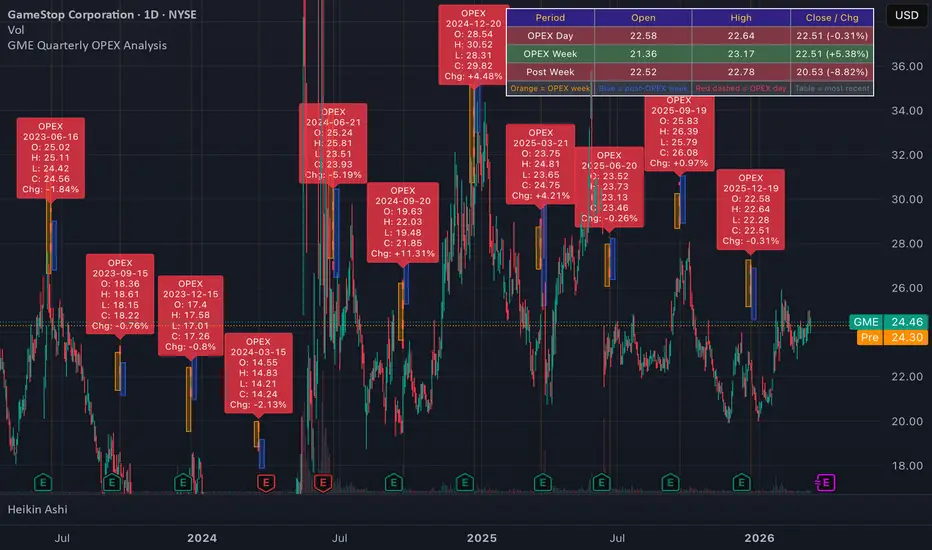
**GME Quarterly OPEX Analyzer** — marks every quarterly expiration date (3rd Friday of March, June, September, December) on a GME daily chart going back as far as chart data allows. For each OPEX it draws a red dashed vertical line, labels the day's OHLC and % change, shades the full OPEX week in orange, and shades the following week in blue. A table in the top-right shows the most recent OPEX day, OPEX week, and post-OPEX week OHLC with color-coded green/red results. Useful for visually identifying whether quarterly OPEX dates correlate with local price bottoms, tops, or reversals over time.
Script open-source
Nello spirito di TradingView, l'autore di questo script lo ha reso open source, in modo che i trader possano esaminarne e verificarne la funzionalità. Complimenti all'autore! Sebbene sia possibile utilizzarlo gratuitamente, ricordiamo che la ripubblicazione del codice è soggetta al nostro Regolamento.

Declinazione di responsabilità
Le informazioni e le pubblicazioni non sono intese come, e non costituiscono, consulenza o raccomandazioni finanziarie, di investimento, di trading o di altro tipo fornite o approvate da TradingView. Per ulteriori informazioni, consultare i Termini di utilizzo.
Script open-source
Nello spirito di TradingView, l'autore di questo script lo ha reso open source, in modo che i trader possano esaminarne e verificarne la funzionalità. Complimenti all'autore! Sebbene sia possibile utilizzarlo gratuitamente, ricordiamo che la ripubblicazione del codice è soggetta al nostro Regolamento.
Declinazione di responsabilità
Le informazioni e le pubblicazioni non sono intese come, e non costituiscono, consulenza o raccomandazioni finanziarie, di investimento, di trading o di altro tipo fornite o approvate da TradingView. Per ulteriori informazioni, consultare i Termini di utilizzo.