OPEN-SOURCE SCRIPT
Adaptive Support & Resistance Pro + Signals
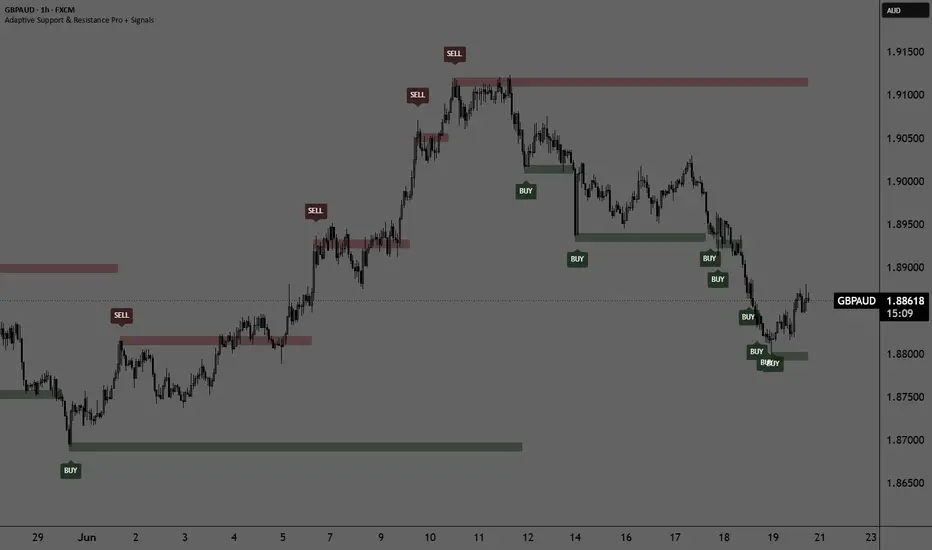
Overview
Adaptive Support & Resistance Pro is a dynamic technical analysis tool designed to automatically identify, calculate, and plot key Support and Resistance (S/R) levels on your chart. Unlike traditional pivot-based indicators, this script uses a hybrid approach combining Momentum, Relative Strength, and Volatility filters to pinpoint institutional supply and demand zones.
To ensure professional-grade execution, the script is fully optimized to prevent repainting. It operates strictly in real-time, aligning historical signals with the exact moments these key levels were formed.
How It Works (The Engine)
The indicator calculates its levels based on three core components:
Chande Momentum Oscillator (CMO) via HMA: It analyzes the rate of change between two Hull Moving Averages (HMA) of different periods to detect strong shifts in market momentum.
Relative Strength Index (RSI): A 9-period RSI filters out minor market noise, ensuring that support levels are only tracked in oversold conditions ( RSI < 25$) and resistance levels in overbought conditions (RSI > 75$).
Legacy Close Pivots: The script analyzes extreme high/low deviations over a specific lookback period to establish the structural price floor or ceiling.
When all three conditions align, a new Support or Resistance price level is established.
Key Features & Settings
Multi-Timeframe (S/R Timeframe): You can plot S/R levels from higher timeframes (e.g., Daily or 4-Hour) directly onto your lower timeframe execution chart (e.g., 15-minute) for top-down analysis.
Signal Trigger Modes: Under the settings, you can choose how signals are displayed:
On Candle Close: Displays a BUY or SELL label immediately on the candle that confirmed the new level.
After Candle Close: Waits for the confirmation candle to close and prints the signal on the next candle, providing an extra layer of validation.
Strict One Signal Per Level Rule: The script features built-in logic that guarantees only one signal will ever be triggered per new structural level, completely eliminating label clutter and overlapping signals.
How to Use It (Trading Strategy)
Support & BUY Signals: Look for green BUY labels after the market prints a fresh support line. This indicates that momentum has shifted upwards from an oversold structural area.
Resistance & SELL Signals: Look for red SELL labels when price prints a fresh resistance line. This indicates institutional selling pressure in an overbought area.
Breakouts & Re-tests: The drawn lines stay on the chart, allowing you to monitor future re-tests of these adaptive zones.
Disclaimer
Past performance does not guarantee future results. This indicator is meant to be used as a supportive tool alongside your own risk management and trading plan.
Adaptive Support & Resistance Pro is a dynamic technical analysis tool designed to automatically identify, calculate, and plot key Support and Resistance (S/R) levels on your chart. Unlike traditional pivot-based indicators, this script uses a hybrid approach combining Momentum, Relative Strength, and Volatility filters to pinpoint institutional supply and demand zones.
To ensure professional-grade execution, the script is fully optimized to prevent repainting. It operates strictly in real-time, aligning historical signals with the exact moments these key levels were formed.
How It Works (The Engine)
The indicator calculates its levels based on three core components:
Chande Momentum Oscillator (CMO) via HMA: It analyzes the rate of change between two Hull Moving Averages (HMA) of different periods to detect strong shifts in market momentum.
Relative Strength Index (RSI): A 9-period RSI filters out minor market noise, ensuring that support levels are only tracked in oversold conditions (
RSI < 25$) and resistance levels in overbought conditions (RSI > 75$).Legacy Close Pivots: The script analyzes extreme high/low deviations over a specific lookback period to establish the structural price floor or ceiling.
When all three conditions align, a new Support or Resistance price level is established.
Key Features & Settings
Multi-Timeframe (S/R Timeframe): You can plot S/R levels from higher timeframes (e.g., Daily or 4-Hour) directly onto your lower timeframe execution chart (e.g., 15-minute) for top-down analysis.
Signal Trigger Modes: Under the settings, you can choose how signals are displayed:
On Candle Close: Displays a BUY or SELL label immediately on the candle that confirmed the new level.
After Candle Close: Waits for the confirmation candle to close and prints the signal on the next candle, providing an extra layer of validation.
Strict One Signal Per Level Rule: The script features built-in logic that guarantees only one signal will ever be triggered per new structural level, completely eliminating label clutter and overlapping signals.
How to Use It (Trading Strategy)
Support & BUY Signals: Look for green BUY labels after the market prints a fresh support line. This indicates that momentum has shifted upwards from an oversold structural area.
Resistance & SELL Signals: Look for red SELL labels when price prints a fresh resistance line. This indicates institutional selling pressure in an overbought area.
Breakouts & Re-tests: The drawn lines stay on the chart, allowing you to monitor future re-tests of these adaptive zones.
Disclaimer
Past performance does not guarantee future results. This indicator is meant to be used as a supportive tool alongside your own risk management and trading plan.
Script open-source
Nello spirito di TradingView, l'autore di questo script lo ha reso open source, in modo che i trader possano esaminarne e verificarne la funzionalità. Complimenti all'autore! Sebbene sia possibile utilizzarlo gratuitamente, ricordiamo che la ripubblicazione del codice è soggetta al nostro Regolamento.

Free telegram channel t.me/alexmasterforex
Declinazione di responsabilità
Le informazioni e le pubblicazioni non sono intese come, e non costituiscono, consulenza o raccomandazioni finanziarie, di investimento, di trading o di altro tipo fornite o approvate da TradingView. Per ulteriori informazioni, consultare i Termini di utilizzo.
Script open-source
Nello spirito di TradingView, l'autore di questo script lo ha reso open source, in modo che i trader possano esaminarne e verificarne la funzionalità. Complimenti all'autore! Sebbene sia possibile utilizzarlo gratuitamente, ricordiamo che la ripubblicazione del codice è soggetta al nostro Regolamento.
Free telegram channel t.me/alexmasterforex
Declinazione di responsabilità
Le informazioni e le pubblicazioni non sono intese come, e non costituiscono, consulenza o raccomandazioni finanziarie, di investimento, di trading o di altro tipo fornite o approvate da TradingView. Per ulteriori informazioni, consultare i Termini di utilizzo.