Aggiornato
STRYK: SVP
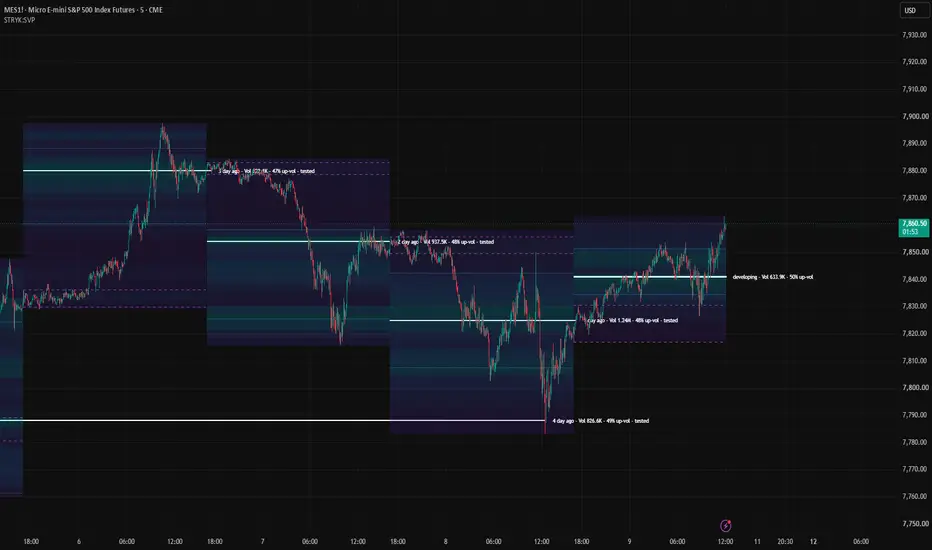
STRYK: SVP — Session Volume Profile
One volume profile per period, hour to month, or per futures session, drawn where the session happened, and every session's point of control carried forward until price trades through it. Built for CME index futures on an intraday chart.
What it draws. A profile for each of the last N sessions, either as a heatmap, where every price row is shaded by how much traded there, or as classic horizontal bars. That session's POC, extended to the right with a tag reading, for example, 2 sessions, Vol 36.3K, 52% up-vol. Naked POCs, meaning nobody has traded back through them since that session closed, stay bright; tested ones fade and, by default, stop at the bar that tested them, so what is left on the chart is the set of levels the market still owes a visit. Value area high and low, the band holding 70 percent of the session's volume around the POC, with optional shading. And the developing profile of the session in progress, rebuilt every bar, with its own POC, value area and tag.
How the profile is built. The lower-timeframe bars inside each chart bar, one-minute by default, are the raw material. By default each intrabar's volume is spread evenly across every price bin between its low and its high, which is the closest a bar-based profile gets to true volume-at-price and stops one fast minute from dumping all its volume on a single tick; you can instead assign each bar to its close, HLC3 or OHLC4. Each intrabar's volume is also signed by its own direction, so every bin carries an up-volume share and every tag can say how one-sided the session was. Up-volume means volume from rising intrabars, not exchange-recorded buying: it is the same lower-timeframe method STRYK: DELTA-TD uses, benchmarked against real aggressor data at r = 0.64 to 0.74, a good estimate and not a tape. Where lower-timeframe data runs out far back on the chart, the chart bar's own typical price and volume are used instead and the profile there is coarser; the panel says which the live session is built from. The POC and value area are computed at a fine resolution you set in ticks, four by default, independent of how many rows are drawn. The value area expands outward from the POC one price bin at a time over a continuous ladder, so an empty bin inside the range counts as zero rather than being skipped.
Initial balance. The high and low of the session's opening window, 60 minutes by default, drawn live for the developing session and optionally on completed ones. On RTH that is the classic IB; on the full-day preset it is the first hour of Globex, which is a different thing, and the setting is there for you to decide.
Periods. One profile per hour, 4 hours, day, week, two weeks or month, following the exchange calendar exactly as the chart's own bars do: a day is the CME trading day, 17:00 to 16:00 Chicago, Sunday evening through Friday, and a week is Sunday 17:00 to Friday 16:00. Or a time window instead: CME RTH 08:30 to 15:00, the overnight 17:00 to 08:30, or any custom session string with its timezone. Boundaries come from the exchange clock, never from whatever timezone the chart happens to be set to.
The panel. Session in use, how many sessions are kept and how many POCs are still naked, the developing POC, value area, session volume with up-volume share, whether price is inside, above or below value right now, the initial balance, and what the live profile is being built from.
Fully customizable. Eight master switches: everything, profiles, POC lines, value area, developing session, tags, panel, initial balance. Heatmap colours and transparency, bar colours, which end bars grow from and how long they can get, rows per profile, POC colour for naked and tested, width, style, whether tested POCs stop or carry on or disappear, tag contents and size, value area colour, style and shading, developing POC colour and width, panel position, size and colours. Keep up to 30 sessions; rows are clamped automatically to stay inside TradingView's drawing limits and the panel says so if that happens.
Alerts. Price trades through a naked POC. Close crosses the developing POC. Close leaves the developing value area. All on bar close.
Nothing here is a signal. A POC is where the most business was done; what price does when it comes back there is for you to judge. No performance claim is made or implied, and this is not financial advice.
One volume profile per period, hour to month, or per futures session, drawn where the session happened, and every session's point of control carried forward until price trades through it. Built for CME index futures on an intraday chart.
What it draws. A profile for each of the last N sessions, either as a heatmap, where every price row is shaded by how much traded there, or as classic horizontal bars. That session's POC, extended to the right with a tag reading, for example, 2 sessions, Vol 36.3K, 52% up-vol. Naked POCs, meaning nobody has traded back through them since that session closed, stay bright; tested ones fade and, by default, stop at the bar that tested them, so what is left on the chart is the set of levels the market still owes a visit. Value area high and low, the band holding 70 percent of the session's volume around the POC, with optional shading. And the developing profile of the session in progress, rebuilt every bar, with its own POC, value area and tag.
How the profile is built. The lower-timeframe bars inside each chart bar, one-minute by default, are the raw material. By default each intrabar's volume is spread evenly across every price bin between its low and its high, which is the closest a bar-based profile gets to true volume-at-price and stops one fast minute from dumping all its volume on a single tick; you can instead assign each bar to its close, HLC3 or OHLC4. Each intrabar's volume is also signed by its own direction, so every bin carries an up-volume share and every tag can say how one-sided the session was. Up-volume means volume from rising intrabars, not exchange-recorded buying: it is the same lower-timeframe method STRYK: DELTA-TD uses, benchmarked against real aggressor data at r = 0.64 to 0.74, a good estimate and not a tape. Where lower-timeframe data runs out far back on the chart, the chart bar's own typical price and volume are used instead and the profile there is coarser; the panel says which the live session is built from. The POC and value area are computed at a fine resolution you set in ticks, four by default, independent of how many rows are drawn. The value area expands outward from the POC one price bin at a time over a continuous ladder, so an empty bin inside the range counts as zero rather than being skipped.
Initial balance. The high and low of the session's opening window, 60 minutes by default, drawn live for the developing session and optionally on completed ones. On RTH that is the classic IB; on the full-day preset it is the first hour of Globex, which is a different thing, and the setting is there for you to decide.
Periods. One profile per hour, 4 hours, day, week, two weeks or month, following the exchange calendar exactly as the chart's own bars do: a day is the CME trading day, 17:00 to 16:00 Chicago, Sunday evening through Friday, and a week is Sunday 17:00 to Friday 16:00. Or a time window instead: CME RTH 08:30 to 15:00, the overnight 17:00 to 08:30, or any custom session string with its timezone. Boundaries come from the exchange clock, never from whatever timezone the chart happens to be set to.
The panel. Session in use, how many sessions are kept and how many POCs are still naked, the developing POC, value area, session volume with up-volume share, whether price is inside, above or below value right now, the initial balance, and what the live profile is being built from.
Fully customizable. Eight master switches: everything, profiles, POC lines, value area, developing session, tags, panel, initial balance. Heatmap colours and transparency, bar colours, which end bars grow from and how long they can get, rows per profile, POC colour for naked and tested, width, style, whether tested POCs stop or carry on or disappear, tag contents and size, value area colour, style and shading, developing POC colour and width, panel position, size and colours. Keep up to 30 sessions; rows are clamped automatically to stay inside TradingView's drawing limits and the panel says so if that happens.
Alerts. Price trades through a naked POC. Close crosses the developing POC. Close leaves the developing value area. All on bar close.
Nothing here is a signal. A POC is where the most business was done; what price does when it comes back there is for you to judge. No performance claim is made or implied, and this is not financial advice.
Note di rilascio
STRYK: SVP — Session Volume ProfileOne volume profile per period, hour to month, or per CME session, drawn where it happened, with every period's point of control carried forward until price trades through it. Naked POCs stay bright, tested ones fade and stop where they were tested, so what is left on the chart is the set of levels the market still owes a visit. Each POC carries a tag: how many periods ago, the volume, and the up-volume share.
Periods follow the exchange calendar the same way the chart's own bars do. A day is the CME trading day, 17:00 to 16:00 Chicago, Sunday evening through Friday; a week is Sunday 17:00 to Friday 16:00. RTH, overnight and custom session windows are there too, all placed on the exchange clock regardless of the chart's timezone.
Each profile shows as a heatmap or classic bars, with value area high and low, optional shading, the initial balance, and a developing profile for the period in progress that rebuilds every bar with its own POC and value area.
The profile is built from the lower-timeframe bars inside each chart bar, one-minute by default, with each bar's volume spread across its full range so one fast minute cannot pile everything on a single tick. POC and value area are computed at a tick resolution you set, and the value area expands over a continuous price ladder so empty bins count as zero rather than being skipped. Up-volume means volume from rising intrabars, not exchange buy volume: the same lower-timeframe method as STRYK: DELTA-TD, benchmarked against real aggressor data at r = 0.64 to 0.74, a good estimate and not a tape.
Candle colouring, nine engines behind one master switch and a dropdown. Delta HTF candles is the STRYK:DRE engine: bars coloured against the delta timeframe's volume profile, neutral inside value, bull above, bear below, brighter with distance, agreeing delta, acceptance, relative volume and POC migration, every factor adjustable. Delta HTF gradient is the Delta Candles engine, the live accumulating delta of the higher-timeframe candle alone. Then delta gradient and delta sign on the bar itself, position in the value area, distance from the POC, volume at price as a heatmap on the candles, naked POC proximity, and the session's up-volume share. Wicks and borders take the colour too.
The panel shows the period in use, sessions kept and how many POCs are still naked, the developing POC, value area, volume and up-volume share, whether price is inside, above or below value, the initial balance, and what the live profile is built from.
Nine master switches and full colour, width, style and transparency control over every element. Alerts on bar close for a naked POC being touched, the developing POC being crossed, and price leaving the developing value area.
Nothing here is a signal. A POC is where the most business was done; what price does when it comes back there is for you to judge. No performance claim is made or implied, and this is not financial advice.

Declinazione di responsabilità
Le informazioni e le pubblicazioni non sono intese come, e non costituiscono, consulenza o raccomandazioni finanziarie, di investimento, di trading o di altro tipo fornite o approvate da TradingView. Per ulteriori informazioni, consultare i Termini di utilizzo.
Declinazione di responsabilità
Le informazioni e le pubblicazioni non sono intese come, e non costituiscono, consulenza o raccomandazioni finanziarie, di investimento, di trading o di altro tipo fornite o approvate da TradingView. Per ulteriori informazioni, consultare i Termini di utilizzo.