OPEN-SOURCE SCRIPT
Aggiornato Beyond Insights Indicator
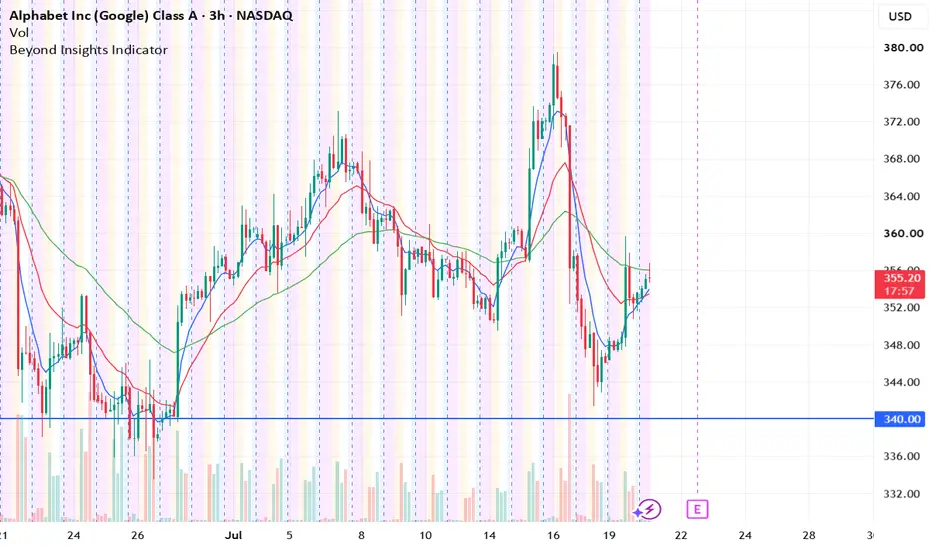
The Beyond Insights Indicator is a multi-timeframe overlay tool designed for TradingView that displays key Exponential Moving Averages (EMAs) and volatility insights to support various trading strategies. It intelligently adapts its display based on the current chart timeframe to reduce clutter and enhance relevance. Specifically, it shows EMA 6, 18, and 50 when viewing intraday timeframes.
In addition to EMAs, the indicator includes an ATR (Average True Range) calculation with a default length of 14, offering insight into market volatility.
In addition to EMAs, the indicator includes an ATR (Average True Range) calculation with a default length of 14, offering insight into market volatility.
Note di rilascio
Purpose of the Script:When you switch between Monthly/Weekly/Daily charts, you only see the corresponding EMA20/50/200 lines (styled slightly differently to indicate the timeframe).
When you drop to any intraday chart (1 min, 5 min, 1 hour…), you instead see faster EMAs (6, 18, 50) suited to that shorter timeframe.
No matter which timeframe you’re on, there’s always a small overlay table in the top-right showing the current 14-period ATR reading.
The ATR reading in the corner gives you an immediate sense of current volatility without opening a separate indicator pane.
Note di rilascio
Updated ATR to Two Decimal.Make the ATR more visible (Shifted to left)
Note di rilascio
Updated with gapping table. Note di rilascio
Updated with dynamic gapping following our syllabus. Note di rilascio
Revert back to BI Indicator without the max gap down indicator. Note di rilascio
Added an indicator for the largest gap down within 2yr of the daily chart.Note di rilascio
Retain 2x2 Table (ATR & Max Gap Down) to Monthly, Weekly & Daily timeframe only. Note di rilascio
Here are the changes made to your Beyond Insights Indicator:- Single column — merged the two-column label/value layout into one combined column
- Swapped row order — Gap Down now in row 1, ATR in row 2, with a small padding row at the top
- Right-aligned — all table text now aligned to the right
- No outline — removed white background, gray border, and frame; background is now transparent
- Top padding — added an empty row 0 for breathing room above the data
- Font size 12 — switched from the default size.normal (14) to an explicit integer value of 12, sitting between small (10) and normal (14)
The EMA ribbon and all calculation logic (ATR, Gap Down scan) remain unchanged.
Note di rilascio
The ATR text is now clearly visible in white on your dark chart.Note di rilascio
Restoring the previous version in order for further revision. Note di rilascio
Change Log — Beyond Insights Indicator v7.2v7.2.1 — Dynamic ATR & Gap Font Color (Theme-Aware)
Date: 28 June 2026
Problem:
The ATR and MaxGapDown table rows used a fixed black font color. Visible on light charts, but completely invisible on dark/night mode charts.
Changes:
Theme detection hardened — replaced chart.bg_color == color.white with chart.bg_color.r > 128. The old check only matched pure white #FFFFFF; the new check reads the background's red channel and treats any value above 128 as a light theme. This covers all TradingView theme variants (cream, light gray, charcoal, dark blue, etc.) without hard-coding specific colors.
ATR row font now switches dynamically: black on light charts, white on dark charts.
MaxGapDown row font inherits the same dynamic logic — black on light, white on dark — but retains its red override when a gap ≤ −5% is detected (the red warning indicator is intentional).
Before / After:
Dark chart — ATR text: Invisible (black on dark) → White ✅
Dark chart — Gap Down text: Invisible (black on dark) → White (or red if ≤ −5%) ✅
Light chart — ATR text: Black ✅ → Black ✅ (unchanged)
Light chart — Gap Down text: Black ✅ → Black (or red if ≤ −5%) ✅
Non-standard light themes (cream, gray): Invisible (black-on-black due to == color.white failing) → Black ✅
Lines affected: Table cell color assignments for the ATR and Gap Down data rows (top-right info panel).
Note di rilascio
Increased Gap Down font size upon feedback. Note di rilascio
DescriptionBeyond Insights Indicator overlays timeframe-aware Exponential Moving Averages (EMAs), Average True Range (ATR), and a 2-year maximum gap-down scan directly on your chart. It adapts its display to whichever timeframe you are viewing — no manual configuration needed.
What It Does
- EMA 20, 50, 200 — plotted on Monthly, Weekly, and Daily charts. Red (20), green (50), purple (200). Line thickness increases on Weekly for visual emphasis.
- EMA 6, 18, 50 — plotted on all intraday timeframes (1m – 45m). Blue (6), red (18), green (50). Suited for short-term intraday trend and momentum.
- ATR(14) — displayed as a numeric value in a top-right table on Daily, Weekly, and Monthly charts only. Helps set stop-loss distances and assess volatility.
- Max Gap Down (2-year) — scans the last ~2 years of daily bars to find the largest single-day gap down (open below prior close, as a percentage). Shows both the percentage and the date it occurred. Highlights in red when the gap exceeds −5%.
On hourly (60m) charts, only the intraday EMAs are plotted — the table and gap-down scan are suppressed because they rely on daily candle context.
How It Works
- EMA calculations use ta.ema() with standard periods. The script checks timeframe.ismonthly, timeframe.isweekly, timeframe.isdaily, and falls back to intraday for all shorter intervals.
- ATR is computed with a 14-period length via ta.atr() and refreshed every bar.
- Gap Down Scanner runs inside a request.security() call on the daily timeframe regardless of your chart's interval. It loops through up to 500 historical daily bars anchored to a rolling 2-year window (time − 2 years), calculates each day's gap as (open − prior close) / prior close × 100, and retains the most negative value. The 500-bar cap covers ~2 calendar years of trading days while staying safely within Pine Script's historical buffer during bar replay.
- The table appears at the top-right corner with a fully transparent background so it never obstructs price action. Text color dynamically adapts to your chart's background (dark → white text, light → black text).
How to Use
- Daily / Weekly / Monthly charts — use the EMA 20/50/200 stack to assess trend structure. Price above all three suggests a strong uptrend; EMA 20 crossing below EMA 50 signals short-term weakness. The ATR reading helps size your stop-loss. The Max Gap Down shows the worst single-day open gap in the last two years — useful for sizing risk on overnight holds.
- Intraday charts — use EMA 6/18/50 for short-term trend and momentum. EMA 6 above EMA 18 with both above EMA 50 suggests bullish intraday momentum.
- Bar Replay safe — the gap-down scanner's lookback loop uses math.min(500, bar_index) and a na(time) guard, so it will not throw offset errors when replaying historical bars.
Default Settings
- EMA periods (D/W/M): 20, 50, 200
- EMA periods (Intraday): 6, 18, 50
- ATR length: 14
- Gap-down lookback: 2 years (~500 daily bars)
- Gap-down warning threshold: −5% (shown in red)
- Table position: Top-right, transparent background
- Text color: Auto light/dark based on chart background
This indicator is open-source and free to use. It does not generate buy/sell signals or trading alerts — it provides contextual market data to support your own analysis.
Originality
While individual EMAs and ATR are standard tools, this script's value lies in its timeframe-aware aggregation: it automatically selects the correct EMA periods and table content without requiring the user to switch scripts or adjust settings when changing timeframes. The 2-year max gap-down scanner is purpose-built for swing and position traders who want a quick reference for historical overnight gap risk — a metric not available in TradingView's built-in indicator set.
Script open-source
Nello spirito di TradingView, l'autore di questo script lo ha reso open source, in modo che i trader possano esaminarne e verificarne la funzionalità. Complimenti all'autore! Sebbene sia possibile utilizzarlo gratuitamente, ricordiamo che la ripubblicazione del codice è soggetta al nostro Regolamento.

Declinazione di responsabilità
Le informazioni e le pubblicazioni non sono intese come, e non costituiscono, consulenza o raccomandazioni finanziarie, di investimento, di trading o di altro tipo fornite o approvate da TradingView. Per ulteriori informazioni, consultare i Termini di utilizzo.
Script open-source
Nello spirito di TradingView, l'autore di questo script lo ha reso open source, in modo che i trader possano esaminarne e verificarne la funzionalità. Complimenti all'autore! Sebbene sia possibile utilizzarlo gratuitamente, ricordiamo che la ripubblicazione del codice è soggetta al nostro Regolamento.
Declinazione di responsabilità
Le informazioni e le pubblicazioni non sono intese come, e non costituiscono, consulenza o raccomandazioni finanziarie, di investimento, di trading o di altro tipo fornite o approvate da TradingView. Per ulteriori informazioni, consultare i Termini di utilizzo.