OPEN-SOURCE SCRIPT
SS Keltner Line
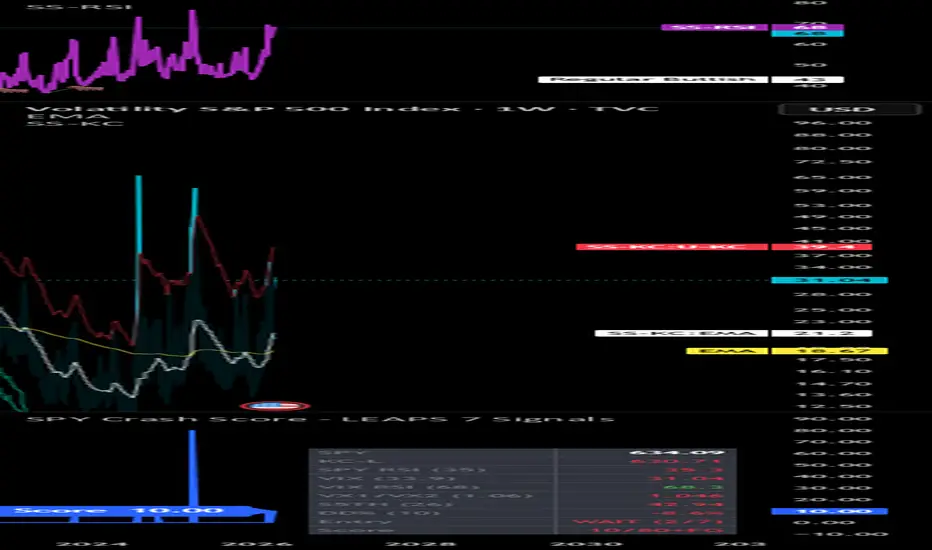
A customised Keltner Channel indicator designed for crash detection and mean-reversion entries on SPY and broad market indices. Unlike standard Keltner Channel implementations, this version uses an asymmetric band structure — a wider upper band for overbought detection and two tiered lower bands to distinguish between moderate and deep oversold conditions.
Band structure:
Upper band — EMA + 2.75 × ATR(10) — blue. Overbought / extended zone
Basis — 20-period EMA — yellow. Mean reversion target / take profit level
Lower band 2.0 — EMA − 2.0 × ATR(10) — green. First oversold zone, initial entry consideration
Lower band 2.5 — EMA − 2.5 × ATR(10) — red. Deep oversold zone, high-conviction entry
Visual fill zones:
Light blue fill between upper band and EMA — extended/overbought territory
Light green fill between EMA and lower 2.0 — mild pullback zone
Light red fill between lower 2.0 and lower 2.5 — deep crash zone, primary LEAPS entry region
Intended use:
On the weekly chart, a SPY close at or below the green lower band (2.0×) forms part of a multi-signal crash entry system. A close into the red zone (2.5×) represents an extreme reading historically associated with maximum fear entries. The EMA basis serves as the primary take-profit target on mean reversion.
Part of the SS LEAPS crash trading system. Best used on weekly timeframe alongside VIX RSI, Fear & Greed, S5TH breadth, and VX1!/VX2! backwardation signals.
Band structure:
Upper band — EMA + 2.75 × ATR(10) — blue. Overbought / extended zone
Basis — 20-period EMA — yellow. Mean reversion target / take profit level
Lower band 2.0 — EMA − 2.0 × ATR(10) — green. First oversold zone, initial entry consideration
Lower band 2.5 — EMA − 2.5 × ATR(10) — red. Deep oversold zone, high-conviction entry
Visual fill zones:
Light blue fill between upper band and EMA — extended/overbought territory
Light green fill between EMA and lower 2.0 — mild pullback zone
Light red fill between lower 2.0 and lower 2.5 — deep crash zone, primary LEAPS entry region
Intended use:
On the weekly chart, a SPY close at or below the green lower band (2.0×) forms part of a multi-signal crash entry system. A close into the red zone (2.5×) represents an extreme reading historically associated with maximum fear entries. The EMA basis serves as the primary take-profit target on mean reversion.
Part of the SS LEAPS crash trading system. Best used on weekly timeframe alongside VIX RSI, Fear & Greed, S5TH breadth, and VX1!/VX2! backwardation signals.
Script open-source
Nello spirito di TradingView, l'autore di questo script lo ha reso open source, in modo che i trader possano esaminarne e verificarne la funzionalità. Complimenti all'autore! Sebbene sia possibile utilizzarlo gratuitamente, ricordiamo che la ripubblicazione del codice è soggetta al nostro Regolamento.

Declinazione di responsabilità
Le informazioni e le pubblicazioni non sono intese come, e non costituiscono, consulenza o raccomandazioni finanziarie, di investimento, di trading o di altro tipo fornite o approvate da TradingView. Per ulteriori informazioni, consultare i Termini di utilizzo.
Script open-source
Nello spirito di TradingView, l'autore di questo script lo ha reso open source, in modo che i trader possano esaminarne e verificarne la funzionalità. Complimenti all'autore! Sebbene sia possibile utilizzarlo gratuitamente, ricordiamo che la ripubblicazione del codice è soggetta al nostro Regolamento.
Declinazione di responsabilità
Le informazioni e le pubblicazioni non sono intese come, e non costituiscono, consulenza o raccomandazioni finanziarie, di investimento, di trading o di altro tipo fornite o approvate da TradingView. Per ulteriori informazioni, consultare i Termini di utilizzo.