OPEN-SOURCE SCRIPT
Seasonality: Energy [invincible3]
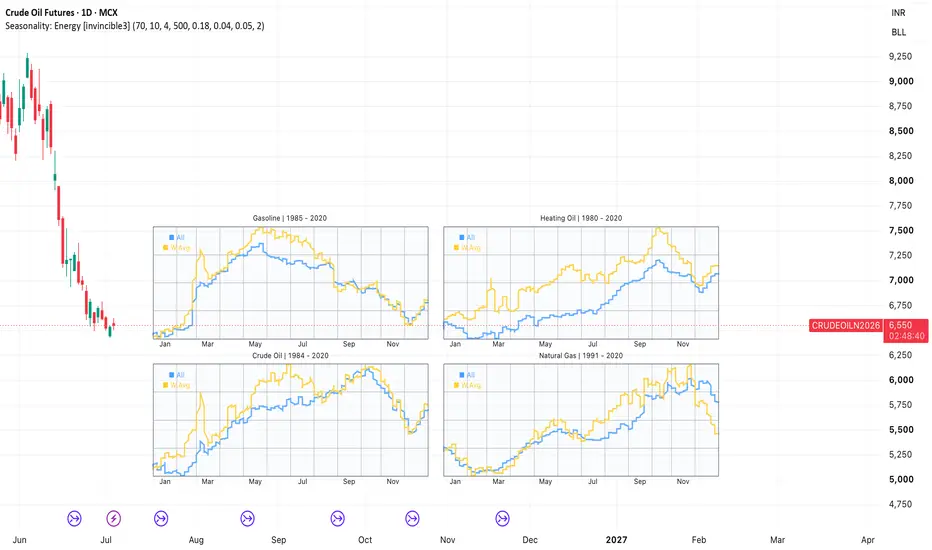
Seasonality: Energy Commodities [invincible3]
This indicator displays compact seasonal mini-charts for major energy markets directly on the price chart. It is designed to provide a quick visual reference for historical seasonal tendencies without disturbing the main candle scaling or chart zoom.
The dashboard includes four energy seasonality panels:
Gasoline | from 1985 to 2020
Crude Oil | from 1984 to 2020
Heating Oil | from 1980 to 2020
Natural Gas | from 1991 to 2020
Each panel contains two seasonal curves:
Blue Line — All Years Average
Shows the average historical seasonal path using all available years from the start year through 2020.
Yellow Line — Weighted Average
Shows a weighted seasonal curve that gives more importance to recent historical behavior while still preserving the broader long-term seasonal structure.
The indicator uses a fixed 365-day seasonal structure, allowing traders to observe how each energy market has historically behaved throughout the calendar year. The mini-charts are drawn as independent widgets using price-space positioning, so they do not interfere with the main price chart, candle scaling, or zoom behavior.
Key Features
Four energy commodity seasonality panels
Historical data from each market’s start year to 2020
All Years and Weighted Average seasonal curves
Compact dashboard-style layout
Auto dark/light theme support
Adjustable widget width, spacing, height, and position
Designed to avoid chart-scaling distortion
Useful for seasonal bias, timing context, and macro/commodity market analysis
How to Use
Use the blue and yellow curves as a seasonal reference, not as standalone buy or sell signals. When both curves point in the same direction during a specific part of the year, that period may represent a historically stronger seasonal tendency. The signal is more useful when combined with trend, support/resistance, volume, fundamentals, and broader market context.
Important Note
This indicator is based on historical seasonal data only. Seasonality does not guarantee future price movement. Market structure, supply-demand conditions, geopolitical events, interest rates, weather, and macroeconomic factors can override historical seasonal tendencies.
This indicator displays compact seasonal mini-charts for major energy markets directly on the price chart. It is designed to provide a quick visual reference for historical seasonal tendencies without disturbing the main candle scaling or chart zoom.
The dashboard includes four energy seasonality panels:
Gasoline | from 1985 to 2020
Crude Oil | from 1984 to 2020
Heating Oil | from 1980 to 2020
Natural Gas | from 1991 to 2020
Each panel contains two seasonal curves:
Blue Line — All Years Average
Shows the average historical seasonal path using all available years from the start year through 2020.
Yellow Line — Weighted Average
Shows a weighted seasonal curve that gives more importance to recent historical behavior while still preserving the broader long-term seasonal structure.
The indicator uses a fixed 365-day seasonal structure, allowing traders to observe how each energy market has historically behaved throughout the calendar year. The mini-charts are drawn as independent widgets using price-space positioning, so they do not interfere with the main price chart, candle scaling, or zoom behavior.
Key Features
Four energy commodity seasonality panels
Historical data from each market’s start year to 2020
All Years and Weighted Average seasonal curves
Compact dashboard-style layout
Auto dark/light theme support
Adjustable widget width, spacing, height, and position
Designed to avoid chart-scaling distortion
Useful for seasonal bias, timing context, and macro/commodity market analysis
How to Use
Use the blue and yellow curves as a seasonal reference, not as standalone buy or sell signals. When both curves point in the same direction during a specific part of the year, that period may represent a historically stronger seasonal tendency. The signal is more useful when combined with trend, support/resistance, volume, fundamentals, and broader market context.
Important Note
This indicator is based on historical seasonal data only. Seasonality does not guarantee future price movement. Market structure, supply-demand conditions, geopolitical events, interest rates, weather, and macroeconomic factors can override historical seasonal tendencies.
Script open-source
Nello spirito di TradingView, l'autore di questo script lo ha reso open source, in modo che i trader possano esaminarne e verificarne la funzionalità. Complimenti all'autore! Sebbene sia possibile utilizzarlo gratuitamente, ricordiamo che la ripubblicazione del codice è soggetta al nostro Regolamento.

Declinazione di responsabilità
Le informazioni e le pubblicazioni non sono intese come, e non costituiscono, consulenza o raccomandazioni finanziarie, di investimento, di trading o di altro tipo fornite o approvate da TradingView. Per ulteriori informazioni, consultare i Termini di utilizzo.
Script open-source
Nello spirito di TradingView, l'autore di questo script lo ha reso open source, in modo che i trader possano esaminarne e verificarne la funzionalità. Complimenti all'autore! Sebbene sia possibile utilizzarlo gratuitamente, ricordiamo che la ripubblicazione del codice è soggetta al nostro Regolamento.
Declinazione di responsabilità
Le informazioni e le pubblicazioni non sono intese come, e non costituiscono, consulenza o raccomandazioni finanziarie, di investimento, di trading o di altro tipo fornite o approvate da TradingView. Per ulteriori informazioni, consultare i Termini di utilizzo.